Drawdown in Forex: Max Drawdown, Recovery Math and Limits
Drawdown explained: how to measure maximum drawdown, why a 50% loss needs a 100% gain, how long losing streaks last, and daily and weekly loss limits.

This site contains affiliate links. We may earn a commission if you sign up through our links. How we research
Drawdown is the drop in your account from its highest earlier value to a later low, usually quoted as a percentage. Maximum drawdown is the biggest such drop over a period, and it is the number that best shows how much a method hurts on the way to any profit. A trader who risks too much per trade will meet a large drawdown even with a method that works on average.
Disclosure: OnForex may earn a referral commission from Exness links on this page. This is general education, not investment advice.
This page shows how to measure drawdown, why recovery gets harder the deeper you fall, how long losing streaks can last, and what rules traders use to limit damage. The numbers on streaks and drawdown come from our own simulation, described below.
How drawdown is measured
Two ideas are enough:
- High-water mark: the highest account equity (balance plus floating profit or loss) you have reached so far.
- Drawdown:
(high-water mark - current equity) / high-water mark.
Example. An account grows from 1,000 USD to 1,300 USD, then falls to 1,040 USD. Drawdown is (1,300 - 1,040) / 1,300 = 20%. If it later climbs to 1,500 USD, the high-water mark resets to 1,500, and the 20% drawdown is over. If the lowest point in the record was 1,040, then 20% is the maximum drawdown.
Some practical points:
- Measure on equity, not balance. Open trades that are losing count, even though you have not closed them. Balance can look fine while an open position is deep in the red.
- A drawdown has two lengths: depth (how far) and duration (how long you stay below the old peak). Duration is often what makes traders quit.
- Report maximum drawdown with the period it covers. "12% over 6 months" and "12% over 6 years" are very different.
- Drawdown measured in R (multiples of the amount risked per trade, see risk reward ratio) is independent of account size, so it is useful for comparing methods.
Why recovery is harder than the fall
A loss of d (as a fraction) needs a gain of 1 / (1 - d) - 1 to get back to the peak. The table shows how fast it grows.
| Drawdown | Gain needed to recover |
|---|---|
| -10% | +11% |
| -20% | +25% |
| -30% | +43% |
| -40% | +67% |
| -50% | +100% |
| -60% | +150% |
| -70% | +233% |
| -80% | +400% |
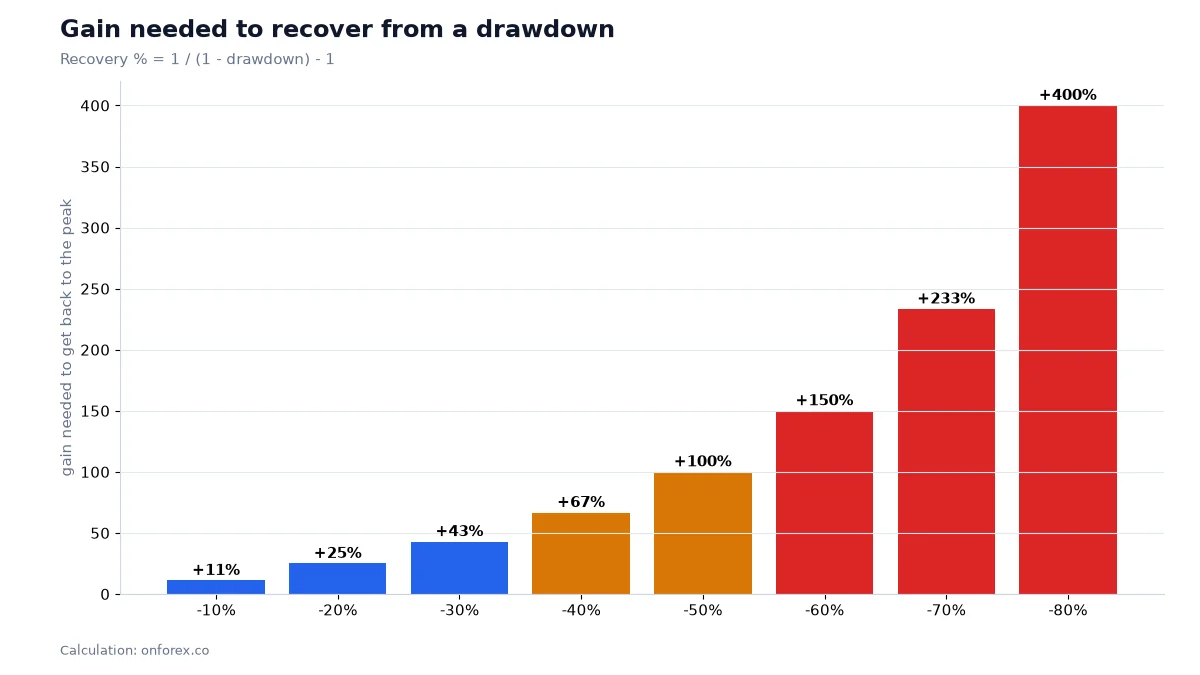
The curve is gentle up to about 20-25% and turns steep after 30%. That is the reason risk rules focus on keeping drawdown shallow rather than on making big recoveries. If you lose 10%, you need roughly 11% to recover, which is realistic. If you lose 50%, you need to double the money, which can take years.
Losing streaks are normal
A losing streak is a run of consecutive losing trades. If your win rate is 45%, the loss rate is 55%, and the chance that the next five trades all lose is 0.55^5, about 5%. That sounds rare, but over 200 trades a run of five or more is almost certain, and a run of eight happens in roughly half of all sequences.
In our simulation of 200 trades at a 45% win rate, the longest losing streak had a median of 8 trades and a 90th percentile of 11. How much those streaks cost depends entirely on your risk per trade:
| Risk per trade | After 5 losses | After 8 losses | After 11 losses |
|---|---|---|---|
| 1% | -4.9% | -7.7% | -10.5% |
| 2% | -9.6% | -14.9% | -19.9% |
| 5% | -22.6% | -33.7% | -43.1% |
| 10% | -41.0% | -57.0% | -68.6% |
These figures assume each loss is the full risk and the risk is a fixed percentage of the current balance, so the dollar risk shrinks as the account does. At 1% the 90th-percentile streak costs about a tenth of the account. At 5% it costs more than 40%, and recovery then needs about +76%.
Our data: drawdown from risk per trade
We ran 20,000 Monte Carlo simulations of a method with a 45% win rate and a 1.5R reward, which has a positive expectancy of +0.125R per trade, and 200 trades per run. We changed only the percent risked per trade.
| Risk per trade | Median maximum drawdown | Runs with drawdown of 30% or more | Runs where the account halved at some point |
|---|---|---|---|
| 0.5% | 5.9% | under 0.3% | 0% |
| 1% | 11.7% | 0.3% | 0% |
| 2% | 22.5% | 19.7% | 0.1% |
| 5% | 49.2% | 96.9% | 14.2% |
| 10% | 78.3% | 100% | 49.7% |
Even at 1% risk, 8.9% of runs ended below the starting balance after 200 trades, despite a positive edge. The simulation shows what luck alone can do. It is not a forecast for any real strategy: your true win rate and ratio are unknown and may be lower.
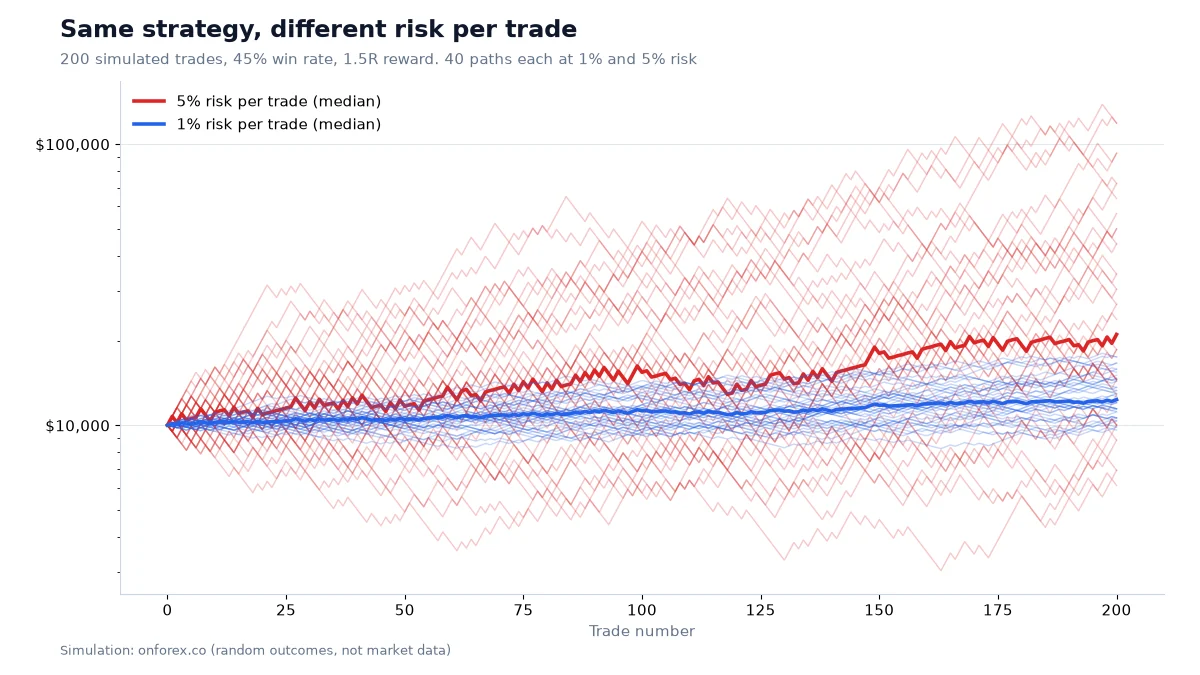
Look at the 5% panel. With the same method, the paths spread from huge gains to near wipe-outs, and the typical path passes through a drawdown near half the account. The 1% paths stay close together and the deepest drawdowns are survivable. For the choice of percentage, see risk per trade.
Drawdown rules traders use
Rules take the decision out of the moment when emotions are high. Common ones:
- Daily loss limit. Stop for the day after losing a fixed amount, such as 2% of the account or 3R. Write it before the session starts.
- Weekly loss limit. For example 5% or 6R. When it is hit, trade demo or review until the next week.
- Consecutive-loss pause. After three or four losing trades in a row, stop and check whether you followed the plan. If you did not, fix the process; if you did, the streak may be normal variance.
- Risk step-down. When drawdown reaches a level (say 10%), halve the risk per trade until you make a new high. This limits the depth of a bad run and keeps the recovery math manageable.
- Maximum drawdown stop. Decide the level at which you stop completely and re-test the method, for instance 15-20%. Write it down in advance.
Prop-firm style limits. Funded-account and evaluation programmes from proprietary trading firms generally set a daily loss limit and an overall (maximum) loss limit, and breaking either ends the account. The exact numbers and the way they are measured (balance or equity, trailing or fixed) differ by firm, so read the terms of the specific programme. The idea is useful even for a personal account: fixed limits on the worst case force position sizes that can survive a bad run.
Whatever you choose, decide it when you are calm, write it into your trading plan, and treat it as a rule, not a suggestion. See psychology and money management.
How to track drawdown in practice
- Record your account equity at the end of each trading day, or after each closed trade if you trade less often.
- In a spreadsheet, keep a column for the running maximum (
=MAX($B$2:B2)). - Next to it, compute drawdown as
=(C2-B2)/C2. - Add a column for R per trade, and a running total of R.
- Review the worst drawdown and the longest time below the peak every month.
Common mistakes
- Doubling the size after losses. It raises the loss of the next trade exactly when a streak is happening. A fixed-percentage rule does the opposite: the stake shrinks as the account falls. In our coin-flip simulation (50% win rate, 1:1, 200 trades, 20,000 runs), doubling after a loss ruined 62.8% of accounts and a fixed 1% stake ruined none. See risk per trade.
- Moving or removing the stop to avoid a loss. The loss becomes larger than the planned 1R and the drawdown deeper. Spreads widen around news and stops can fill with slippage, so keep a margin of safety. See slippage.
- Ignoring floating losses. Equity, not balance, is what the broker uses for margin.
- Trading through the limit. The day you break your daily limit is usually the day you most need it.
- Judging a method on a few trades. A streak of 8 is not proof the method failed. A drawdown well beyond what your testing showed might be.
- Risking too much because "the edge is positive". A positive edge does not prevent large drawdowns; the table above shows it.
Related guides
- Risk per trade: the setting that scales drawdown.
- Risk reward ratio: the break-even win rate and expectancy.
- Position sizing and lot size: turning risk into lots.
- Risk management and stop-loss.
Data source for the simulation: OnForex Monte Carlo analysis, 20,000 runs of 200 trades each, win rate 45%, reward 1.5R, fixed percentage of current balance risked per trade. It does not model spreads, slippage, gaps or changing market conditions.
Practise on a demo account first
Mark structure, FVGs and stops on a free Exness demo account before you risk money. Forex and CFD trading carries a high risk of loss.
Continue to ExnessForex and CFD trading involves significant risk. You may lose your invested capital.
Risk warning: Forex and CFD trading carries a high risk of loss, and you can lose more than you deposit with some products. Simulated results do not predict real results. Daily and weekly limits reduce risk but cannot remove it, because stops can fill beyond their price in fast markets. Nothing here is investment advice.
Related Articles

Forex Order Types: Market, Limit, Stop and OCO Explained
Forex order types explained: market, buy limit, sell limit, buy stop, sell stop, stop loss, take profit, trailing stop, OCO and slippage, with a EURUSD example.

Forex Money Management: Rules, Trade Management and Examples
Forex money management with worked numbers: risk per trade, loss limits, drawdown rules, compounding, plus trade management with BE and trailing stops.
Position Sizing in Forex: How to Calculate the Right Lot Size
Learn how to calculate position size in forex trading: risk-per-trade formulas, lot size calculators, Kelly criterion, and practical examples for any account size.

What Is a Pip in Forex? Pip Value Calculator & Examples
Pip definition explained from scratch. How to calculate pip value for major, minor, and exotic pairs. Practical examples with EUR/USD, USD/JPY, GBP/JPY, and more.
ATR Indicator: Formula, Settings and ATR Stop-Loss in Forex
ATR explained: how Average True Range is calculated with a worked example, the 14-period setting, ATR stops, position sizing and our stop-hit data.

Stop Loss in Forex: Where to Place It (ATR, Structure, Pips)
Where to place a forex stop loss: structure-based, ATR-based and fixed-pip stops compared, how stop distance sets lot size, slippage, gaps, trailing and BE.