Risk Per Trade in Forex: The 1-2% Rule and How to Size It
Risk per trade explained: the 1-2% rule, fixed fractional sizing, a step-by-step lot size calculation, Monte Carlo drawdown results and a careful look at Kelly.

This site contains affiliate links. We may earn a commission if you sign up through our links. How we research
Risk per trade is the amount of money you agree to lose if your stop-loss is hit, usually written as a percentage of account equity. Many traders keep it between 0.5% and 2%, which is the idea behind the 1% rule and the 2% rule. You then work backwards from the stop distance to get the lot size, so the risk stays the same however far the stop is.
Disclosure: OnForex may earn a referral commission from Exness links on this page. This is general education, not investment advice.
This guide covers the formula, a step-by-step lot calculation using a real EURUSD trade plan, our Monte Carlo results for 0.5% to 10% risk, and a brief, careful look at the Kelly criterion.
What risk per trade means (and what it does not)
Risk per trade is not the size of the position or the margin used. It is the loss at the stop:
Risk amount = account equity x risk percentage
On a 1,000 USD account at 1%, the risk amount is 10 USD. If the stop is hit, you lose about 10 USD (plus any slippage), no matter whether the stop is 7.4 pips or 50 pips away. A wide stop gets a smaller position, and a tight stop a larger one. This is fixed fractional sizing, and it is the standard way to link your risk to your account.
Compare it with fixed-lot trading, where you always trade 0.10 lots. A 10-pip stop risks about 10 USD and a 50-pip stop risks about 50 USD on EURUSD, so your real risk changes from trade to trade. The one unit that stays constant under fixed fractional sizing is 1R, the amount risked, which you can use to measure every result (see risk reward ratio).
Step-by-step lot size calculation
We will use a real plan from EURUSD 1H on 28 October 2026. Entry was 1.11321, at the top of a bullish order block (the last down candle before an upward move that broke structure). The stop was 1.11247, below the block with a buffer of 0.2 ATR (average true range, a volatility measure). That is about 7.4 pips. The target was 1.11469, 2R, and price reached the target before the stop.
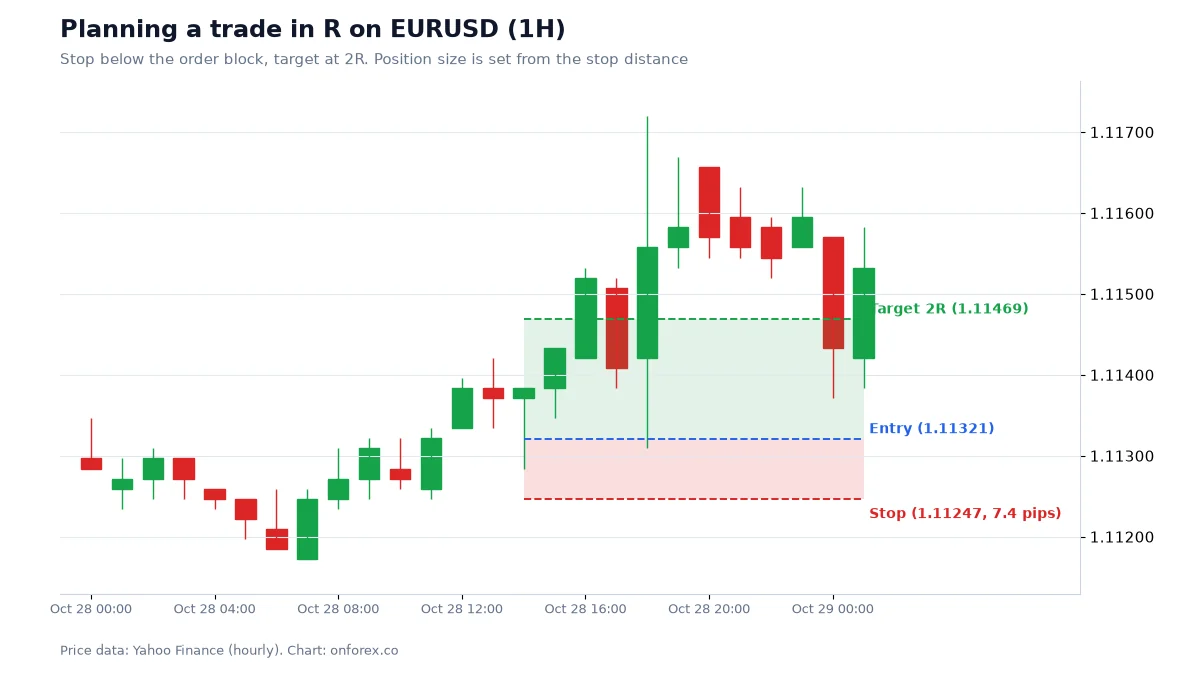
- Fix the risk percentage. We choose 1%.
- Calculate the risk amount. Account 1,000 USD x 1% = 10 USD.
- Measure the stop distance in pips. 1.11321 - 1.11247 = 0.00074, which is 7.4 pips.
- Find the pip value per standard lot. On EURUSD with a USD account, one pip on 1.00 lot is about 10 USD.
- Divide. Lots = 10 / (7.4 x 10) = 0.135, rounded down to 0.13 lots.
- Check the real risk. 0.13 x 7.4 x 10 = 9.62 USD, which is 0.96% of the account.
Always round down. A round-up of 0.135 to 0.14 would risk about 10.36 USD, which is slightly over your rule. See pip value and lot size for pairs where the quote currency is not your account currency (you convert the pip value).
A few more examples with EURUSD (about 10 USD per pip per lot):
| Account | Risk % | Risk amount | Stop | Lots |
|---|---|---|---|---|
| 500 USD | 1% | 5 USD | 10 pips | 0.05 |
| 1,000 USD | 1% | 10 USD | 7.4 pips | 0.13 |
| 1,000 USD | 1% | 10 USD | 20 pips | 0.05 |
| 5,000 USD | 1% | 50 USD | 15 pips | 0.33 |
| 10,000 USD | 0.5% | 50 USD | 25 pips | 0.20 |
| 10,000 USD | 2% | 200 USD | 20 pips | 1.00 |
Three practical notes. First, measure the stop from where you actually expect to be filled, and remember that spreads widen around news and market opens, so a stop placed close to a level can be hit by the spread alone. Second, stops can fill with slippage (a worse price than set), so your loss can exceed 1R in fast markets. Third, on very small accounts the minimum lot of 0.01 may risk more than your rule allows, for example 3 USD on a 30-pip stop is 1.5% of a 200 USD account. In that case use a smaller stop only if the setup allows it, or skip the trade. See position sizing for gold and other instruments.
Why 1-2% and not 5%
The guideline exists because of drawdown arithmetic, not because 1% is magic. We ran 20,000 Monte Carlo simulations of 200 trades with a 45% win rate and a 1.5R reward, which has a positive expectancy of +0.125R per trade, and changed only the risk per trade.
| Risk per trade | Median maximum drawdown | Runs with drawdown of 30% or more | Runs where the account halved at some point |
|---|---|---|---|
| 0.5% | 5.9% | under 0.3% | 0% |
| 1% | 11.7% | 0.3% | 0% |
| 2% | 22.5% | 19.7% | 0.1% |
| 5% | 49.2% | 96.9% | 14.2% |
| 10% | 78.3% | 100% | 49.7% |
The edge is the same in every row. Only the size of the bet changes, and the drawdown rises faster than the risk does. At 1%, 8.9% of runs still finished below the starting balance after 200 trades, which shows that even a sensible size can lose for a while when the edge is thin. Over the 200 trades, the longest losing streak had a median of 8 and a 90th percentile of 11. Eleven losses at 1% cost 10.5% of the account; at 5% they cost 43.1%, and recovering that needs about +76%. See drawdown for the recovery table.
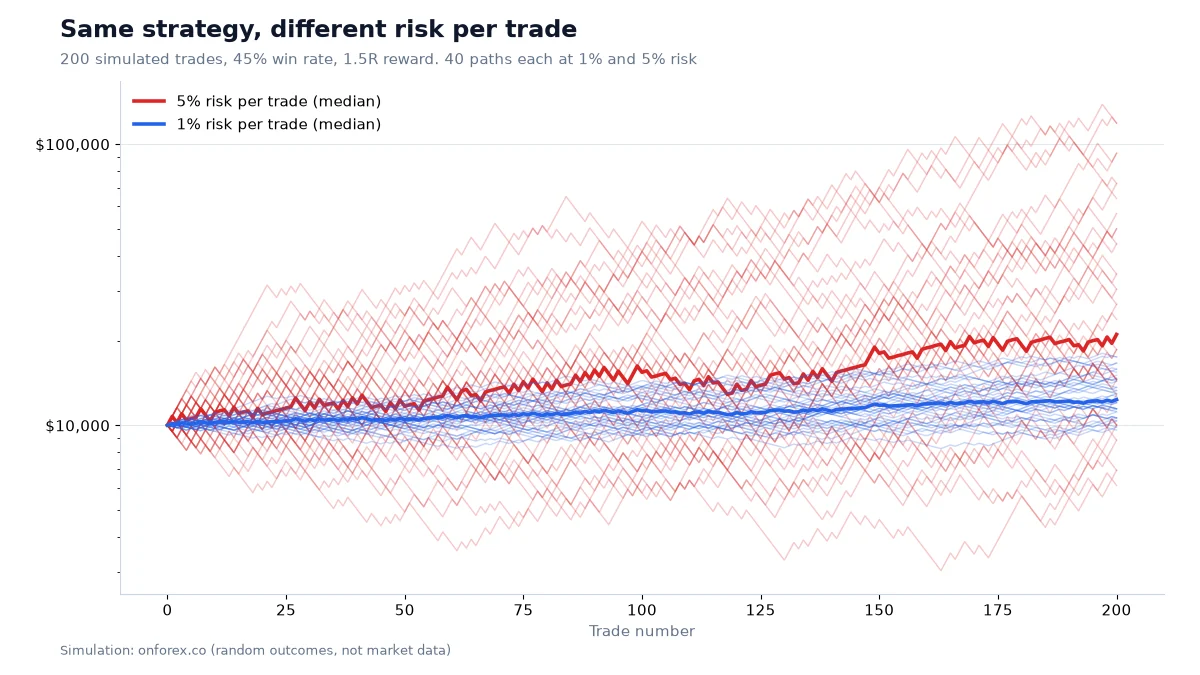
On the log scale, equal vertical distances are equal percentage changes. The 5% paths fan out widely: some climb very far, but many fall, and a typical one goes through a deep hole on the way. The 1% paths are tight. This is the practical meaning of risk per trade: you are choosing how bumpy the ride will be, and whether you will still be trading, and following your plan, at the bottom of it.
Why doubling after a loss is not a risk plan
Martingale sizing raises the stake after each loss to win back the money. We simulated it on a pure coin flip (50% win rate, 1:1 ratio, so no edge and no cost) with 20,000 runs of 200 trades. Doubling after every loss ruined the account in 62.8% of runs, and the median final balance was 0.57 times the start. Multiplying the stake by 1.5 after a loss ruined 15.4%. A fixed 1% stake ruined 0%.
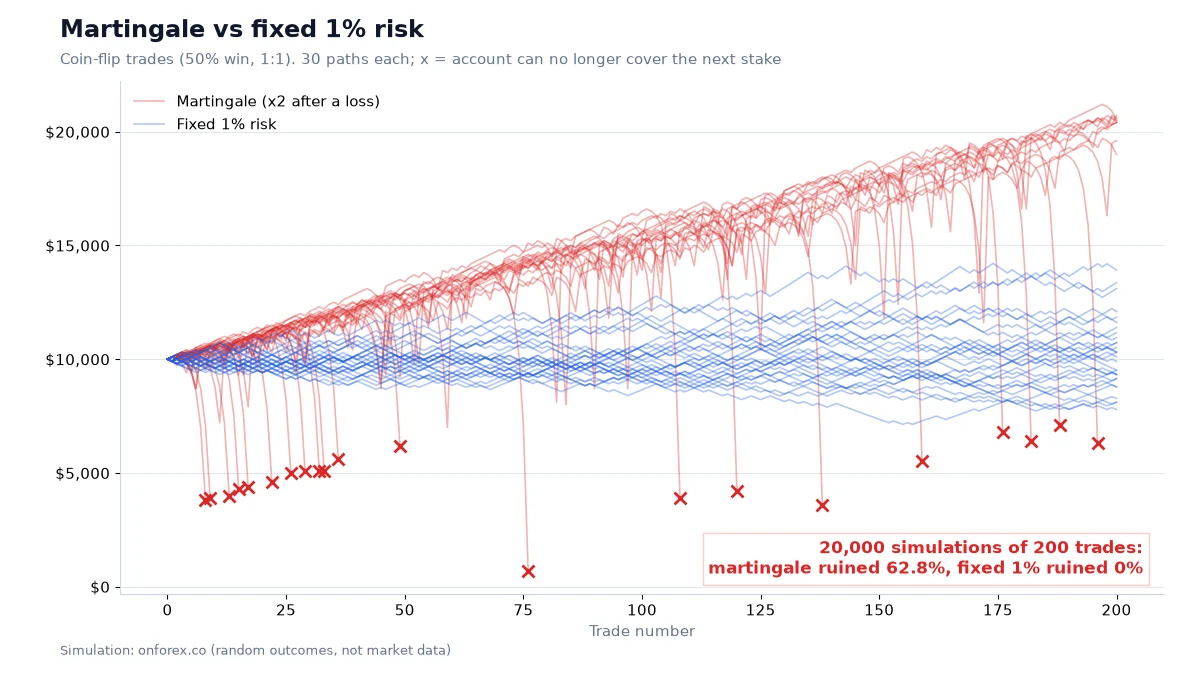
A long losing streak is exactly when this method asks for the largest bet. Keep your risk per trade fixed or shrinking after losses.
Fixed fractional vs fixed amount
| Fixed fractional (% of equity) | Fixed amount (e.g. always 10 USD) | |
|---|---|---|
| After losses | Risk in dollars shrinks | Stays the same |
| After wins | Risk in dollars grows | Stays the same |
| Account can reach zero | In theory never (only gaps and slippage) | Yes, after enough losses |
| Effort | Recalculate lots each trade | Simple |
Most traders recalculate at each trade or weekly. If you recalculate weekly, use the equity at the start of the week and keep it fixed until the next review; it is simple and avoids over-reacting to a single result.
Kelly criterion, briefly and carefully
The Kelly criterion gives the fraction of capital that maximises long-run growth, if you know your true win rate and ratio:
Kelly fraction = W - (1 - W) / R
For the same method (W = 0.45, R = 1.5): 0.45 - 0.55 / 1.5 = 0.45 - 0.367 = 0.083, or 8.3%. Half Kelly is about 4.2%.
Compare that with the table above: 5% risk had a median maximum drawdown of 49.2% in our simulation. So even half Kelly would produce a very rough ride. Reasons to treat Kelly as a ceiling, not a target:
- You never know W and R exactly. Estimates from 100 or 200 trades have wide error bars, and overestimating the edge makes Kelly overbet.
- The formula gives growth-optimal results, not comfortable ones. Drawdowns of 50% are normal at full Kelly.
- Markets change, and the edge can shrink.
- If the estimate is wrong, betting more than Kelly lowers long-run growth, so over-sizing is costly.
For most retail traders the 0.5-2% range is far below Kelly, and that margin is the point. See money management for related frameworks.
How to choose your own number
- Many traders start at 0.5-1% while they test a method on a demo account and, later, with small money.
- Compute your tolerable drawdown. If you would stop trading at -15%, then a risk per trade whose median maximum drawdown is around 12% (like 1% in our simulation) is already near your limit.
- Use the longest likely streak. Multiply your risk by 10 to 11 losses and ask if you can accept it.
- Add portfolio limits. Several open trades in correlated pairs (for example EURUSD and GBPUSD) act like one bigger trade. Cap total open risk at, say, 2-3%.
- Review after each 100 trades. Raise risk only when your real, costed results justify it, and cut it back after a drawdown.
Common mistakes
- Using the same lot size for every trade instead of the same risk.
- Calculating risk from the target instead of from the stop.
- Rounding lots up. Always round down.
- Forgetting costs and slippage, which turn 1R into 1.1R or more.
- Raising the size after a winning streak, then giving it back when variance reverses.
- Treating 1% as a promise of safety. It limits one trade, not a series.
- Mixing margin with risk. Margin is the deposit needed to hold a position; risk is the loss at the stop. See margin.
Related guides
- Position sizing and lot size.
- Drawdown and risk reward ratio.
- Stop-loss and risk management.
Data source: OnForex Monte Carlo analysis, 20,000 runs of 200 trades each, win rate 45%, reward 1.5R, a fixed percentage of current equity risked per trade. It excludes spreads, slippage and gaps. Trade plan: OnForex analysis of hourly EURUSD prices from Yahoo Finance, October 2026.
Practise on a demo account first
Mark structure, FVGs and stops on a free Exness demo account before you risk money. Forex and CFD trading carries a high risk of loss.
Continue to ExnessForex and CFD trading involves significant risk. You may lose your invested capital.
Risk warning: Forex and CFD trading carries a high risk of loss, and you can lose more than you deposit with some products. A fixed percentage limits the planned loss on each trade but cannot cap slippage or gaps. The examples are for education and are not advice on how much you should risk.
Related Articles
Compounding in Forex: Formula, Calculator Table and Reality
How compounding works in forex: the formula, monthly compounding tables, the rule of 72, volatility drag, and our simulation of compounding vs fixed size.
Position Sizing in Forex: How to Calculate the Right Lot Size
Learn how to calculate position size in forex trading: risk-per-trade formulas, lot size calculators, Kelly criterion, and practical examples for any account size.
Forex Risk Management: How to Calculate Risk per Trade
Forex risk management step by step: calculate lot size from a 1% risk and a stop-loss, with USD 1,000 and USD 2,000 EUR/USD examples, drawdown and analytics.

Forex Money Management: Rules, Trade Management and Examples
Forex money management with worked numbers: risk per trade, loss limits, drawdown rules, compounding, plus trade management with BE and trailing stops.
ATR Indicator: Formula, Settings and ATR Stop-Loss in Forex
ATR explained: how Average True Range is calculated with a worked example, the 14-period setting, ATR stops, position sizing and our stop-hit data.
Forex Hedging Explained: Same-Account Hedges, Costs and Rules
How hedging works in forex: opposite positions in one account versus hedging with another pair, with a costed example of spread, swap and margin, and broker rules.