ATR Indicator: Formula, Settings and ATR Stop-Loss in Forex
ATR explained: how Average True Range is calculated with a worked example, the 14-period setting, ATR stops, position sizing and our stop-hit data.
This site contains affiliate links. We may earn a commission if you sign up through our links. How we research
ATR (Average True Range) is a volatility indicator that shows how far price typically moves per candle, expressed in price units such as pips or dollars. It does not show direction. Traders mostly use ATR to place a stop-loss at a distance that fits current conditions, to size a position from that stop, and to judge whether the market is quiet or active.
Disclosure: OnForex may earn a referral commission from Exness links on this page. This is general education, not investment advice.
In this guide you will see the exact calculation with a worked example, the common settings, how to turn ATR into a stop and a lot size, how ATR changes by trading session, and our own data on how often an ATR-based stop gets hit.
What ATR measures
Developed by J. Welles Wilder Jr. and introduced in his 1978 book New Concepts in Technical Trading Systems, ATR answers one question: how big are the candles right now? A reading of 15 pips on a 1-hour EURUSD chart means that, over the recent period, the average candle has covered about 15 pips from its low to its high, once gaps are included.
Three practical points follow:
- ATR depends on the timeframe. 14 bars of 15-minute candles and 14 bars of daily candles give very different numbers.
- ATR depends on the market. A reading of 15 on EURUSD means 15 pips; on gold it might be several dollars.
- ATR is not directional. It would read the same for a steady rise and a steady fall of the same size.
How ATR is calculated
The first step is the true range (TR) of each bar. It is the largest of three values:
- High minus low of the current bar.
- The absolute value of the current high minus the previous close.
- The absolute value of the current low minus the previous close.
Items 2 and 3 are there to include gaps. If price opens far from the previous close, high minus low alone would understate the movement.
ATR is then an average of the true range. Wilder's original method uses a smoothed average:
ATR = (previous ATR x (n - 1) + current TR) / n
where n is the period, usually 14. Many platforms (such as MetaTrader) use a simple moving average of TR instead, so the number can differ slightly from a Wilder-smoothed chart. The idea is the same.
Worked example (illustrative numbers)
The numbers below are made up to show the arithmetic on a 1-hour EURUSD chart. Prices are in pips from the stated levels.
| Bar | Previous close | High | Low | H - L | |H - prev close| | |L - prev close| | True range |
|---|---|---|---|---|---|---|---|
| 1 | 1.1030 | 1.1050 | 1.1020 | 30 | 20 | 10 | 30 pips |
| 2 | 1.1045 | 1.1060 | 1.1035 | 25 | 15 | 10 | 25 pips |
| 3 | 1.1040 | 1.1100 | 1.1050 | 50 | 60 | 10 | 60 pips |
Bar 3 opens above the previous close, and its high minus the previous close (60 pips) is larger than its own range (50 pips). The true range is therefore 60 pips, not 50.
Suppose the 14-period ATR before bar 3 was 15 pips. With Wilder smoothing:
ATR after bar 3 = (15 x 13 + 60) / 14 = 255 / 14 = 18.2 pips
One large bar raised ATR from 15 to 18.2 pips. Because the average is smoothed, ATR lags: it rises after the large bars appear and falls slowly afterwards.
ATR settings
| Period | Behaviour | Typical use |
|---|---|---|
| 7 | Reacts quickly, noisy | Very short-term scalping, tight trailing stops |
| 14 | The default and most widely used | Intraday and swing stops, sizing |
| 21 | Smoother | Swing trading, fewer stop changes |
| 50 | Slow, describes the "normal" level | Judging whether current volatility is above or below average |
Practical advice:
- Keep 14 unless you have a reason. The default is used by so many traders and by most published research that your numbers stay comparable.
- Match the timeframe to the trade. Use ATR on the chart you trade, or on a higher timeframe if you want a stop that ignores short-lived noise.
- Compare ATR with its own history. A single value means little; ATR(14) versus ATR(50) tells you whether volatility is rising or falling.
Using ATR for a stop-loss
A fixed stop in pips ignores the market. A 10-pip stop might be sensible on a quiet day and absurdly tight on a news day. An ATR-based stop scales with the conditions.
The two usual methods:
- Distance from entry. Stop = entry minus (multiple x ATR) for a long, or plus for a short.
- Buffer beyond structure. Place the stop beyond a swing low, order block or other level where your idea would be wrong, then add a buffer of 0.2 to 1 x ATR so that normal noise does not touch it. Our stop-loss guide covers placement logic.
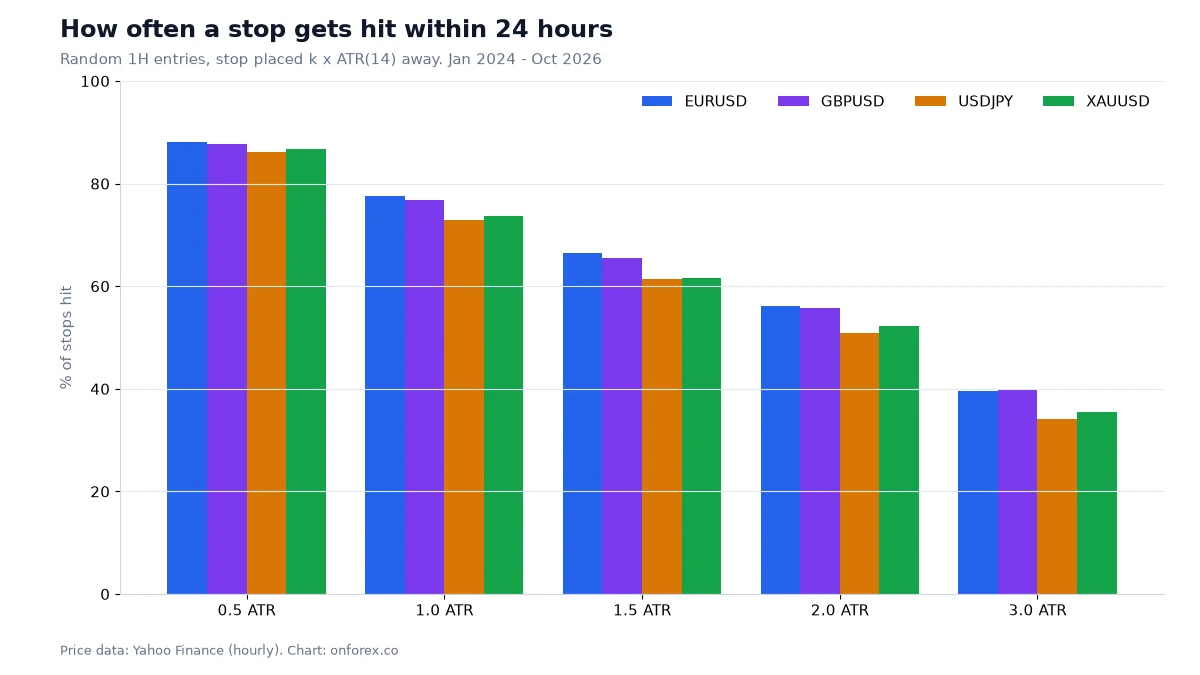
The multiple matters. Our data shows how often a random entry would be stopped out.
| Stop distance | EURUSD | GBPUSD | USDJPY | XAUUSD |
|---|---|---|---|---|
| 0.5 x ATR | 88% | 88% | 86% | 87% |
| 1 x ATR | 78% | 77% | 73% | 74% |
| 1.5 x ATR | 66% | 66% | 61% | 62% |
| 2 x ATR | 56% | 56% | 51% | 52% |
| 3 x ATR | 40% | 40% | 34% | 35% |
Source: OnForex analysis of hourly prices from Yahoo Finance, January 2024 - October 2026 (gold: June 2024 - October 2026, COMEX gold futures). A random entry was taken at any hour and the stop was set k x ATR(14) away; "hit" means price touched the stop within the next 24 hours.
What to take from this:
- A 0.5 ATR stop is hit about 9 times in 10 within a day. It is mostly noise.
- A 1 ATR stop is hit three times in four. Many beginners accidentally use this and conclude that "the market hunts my stop".
- A 2 to 3 ATR stop is hit much less often, but it forces a smaller position for the same risk, which the next section shows.
- These are random entries. A real setup has a reason to be where it is, and a stop behind structure can survive better or worse than this baseline. Test your own method.
Also remember that spreads widen around news and at the daily rollover, and that stops can slip in fast markets, so the realised loss can exceed the planned one. See slippage and the spread guide.
ATR and position sizing
ATR gives you the stop distance; the formula from position sizing then gives you the lots. The advantage is that your risk in money stays the same when volatility changes: larger ATR, wider stop, smaller position.
Example (illustrative): a 1,000 USD account, 1% risk (10 USD), EURUSD 1-hour chart, ATR(14) = 15 pips, stop at 1.5 x ATR.
- Stop distance: 1.5 x 15 = 22.5 pips.
- Pip value per standard lot on EURUSD: about 10 USD.
- Lots = 10 / (22.5 x 10) = 0.044, rounded down to 0.04 lots.
If ATR doubles to 30 pips, the same rule gives a 45-pip stop and 10 / (45 x 10) = 0.022, or 0.02 lots. You take the same 10 USD risk with half the position.
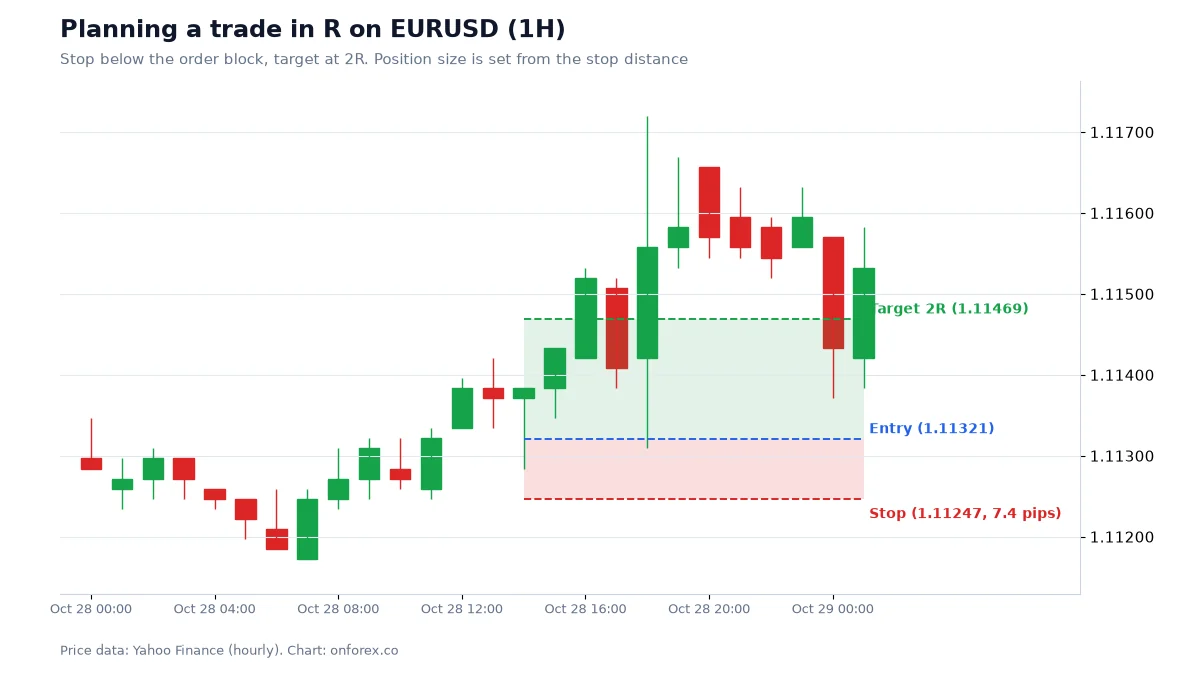
Compare this with the trade plan we use in our risk reward guide: entry 1.11321, stop 1.11247 (a 7.4-pip stop sitting below an order block with a 0.2 ATR buffer), target 1.11469 for a 2R target. The stop came from structure plus an ATR buffer, and the lot size followed from it: 10 / (7.4 x 10) = 0.135, rounded down to 0.13 lots.
ATR by session
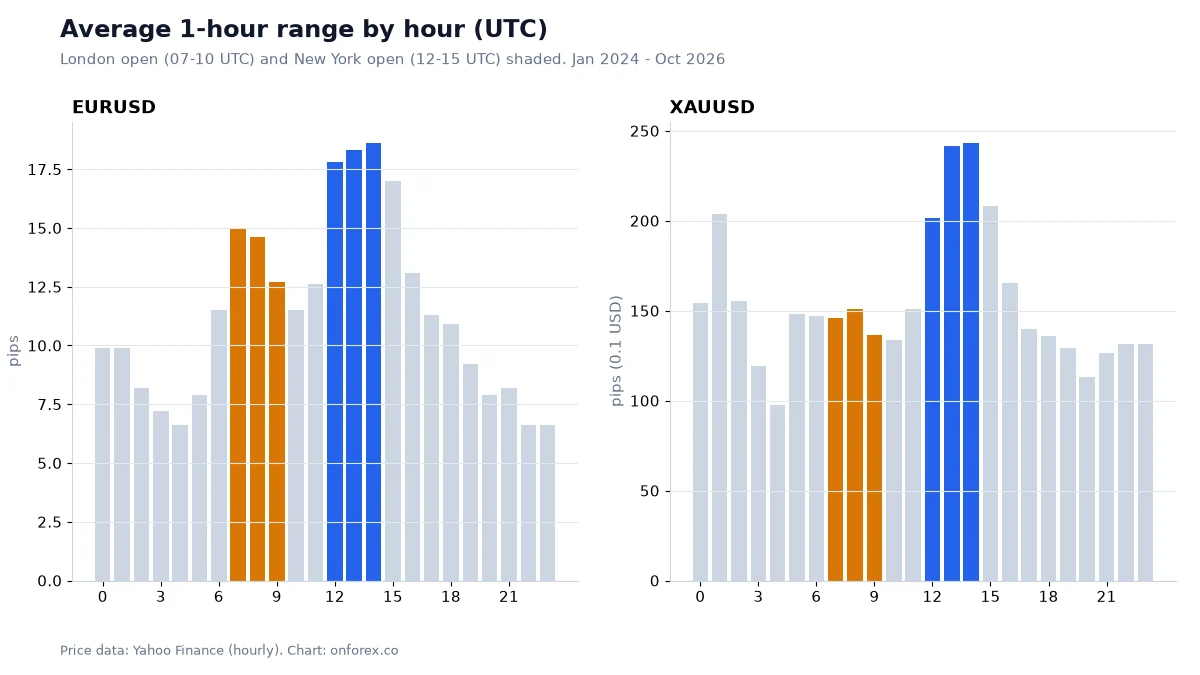
ATR(14) on an hourly chart is the average of the last 14 hours. That means at 08:00 UTC it still contains the quiet Asian hours, and the value at the New York open contains the London session. The hour you trade matters.
Average hourly range in our data:
| Market | Quietest hours | Peak |
|---|---|---|
| EURUSD | about 6.6 to 8 pips (22:00 to 04:00 UTC) | London 07:00 to 08:00 UTC about 15 pips; New York 12:00 to 15:00 UTC 17 to 18.6 pips |
| GBPUSD | about 7.5 pips (22:00 to 23:00 UTC) | 14:00 UTC, 22.9 pips |
| USDJPY | about 14 pips (21:00 UTC) | 13:00 UTC, about 33.8 pips (also 31.4 at 00:00 UTC, Tokyo) |
| XAUUSD | about 10 to 13 USD in late US and Asia | 13:00 to 14:00 UTC, about 24 USD per hour |
Practical consequences:
- An ATR stop set from the overnight reading may be too tight when London opens and the range doubles.
- A stop set at the New York peak may be wider than necessary for the quiet hours that follow.
- If you trade across sessions, compare ATR on your timeframe with the typical range for that hour before fixing the size. See trading hours and ICT kill zones.
These averages describe how big candles tend to be, not which way they go.
Other uses of ATR
- Trailing stop. Trail the stop at a multiple of ATR below the highest high (for longs). The classic "chandelier exit" uses about 3 x ATR(22).
- Targets. Some traders place targets at a multiple of ATR, such as 2 x ATR, to keep the reward in line with the day's range.
- Filters. Skip trades when ATR is unusually low (little movement to pay the spread) or unusually high (news risk).
- Breakout confirmation. A bar larger than 1.5 x ATR can mean a real breakout, but not always; see breakout strategy. In our hourly data, after a break of structure price moved a further 1 ATR before closing back through the level in about 61% to 68% of cases, depending on the market. That is a probability, not a signal.
- Comparing markets. ATR as a percentage of price lets you compare, for example, EURUSD with gold.
Common mistakes
- Using a multiple that is too small. Stops at 0.5 to 1 x ATR are hit most of the time, as the table shows.
- Forgetting the pip value. ATR in pips must be converted to money through the pip value of the pair; see pip value.
- Mixing timeframes. ATR from the daily chart with an entry on the 5-minute chart will give a stop that is far too wide.
- Reading ATR as a signal. A rising ATR is not a buy or sell signal.
- Ignoring the lag. After a spike, ATR stays high for several bars even if the market has calmed; before a spike, it is low.
- Widening the stop to avoid being stopped, without cutting the lot size. Doing that raises the money at risk. The lot size must fall as the stop gets wider.
Related guides
- Stop-loss and position sizing
- Risk per trade and risk reward ratio
- Pip value and lot size
- Market structure and order block
- Martingale and averaging down: why increasing size after a loss is risky
Practise on a demo account first
Try ATR stops and lot calculations on a free Exness demo account before you risk money. Forex and CFD trading carries a high risk of loss.
Continue to ExnessForex and CFD trading involves significant risk. You may lose your invested capital.
Risk warning: Forex and CFD trading carries a high risk of loss and may not be suitable for everyone. ATR describes past volatility and does not predict future price moves or protect against slippage. This page is education, not investment advice.
Related Articles

Forex Risk Management: How to Calculate Risk per Trade
Forex risk management step by step: calculate lot size from a 1% risk and a stop-loss, with USD 1,000 and USD 2,000 EUR/USD examples, drawdown and analytics.

Stop Loss in Forex: Where to Place It (ATR, Structure, Pips)
Where to place a forex stop loss: structure-based, ATR-based and fixed-pip stops compared, how stop distance sets lot size, slippage, gaps, trailing and BE.
ADX Indicator: Settings, +DI/-DI and What Our Data Shows
ADX indicator guide: how ADX and +DI/-DI are calculated, what 20, 25 and 40 mean, how to use ADX to pick a method, and what our data shows on four markets.

Trailing Stop Loss in Forex: Trailing, Break Even and Partial TP
How a trailing stop loss works in forex, plus break even stops and partial take profit, compared on the same EURUSD entries with our own test data.

Parabolic SAR: Settings, Formula and Backtest Results
Parabolic SAR explained: the formula, 0.02 / 0.2 settings, how to read the dots, why it whipsaws, and what a flip-every-signal test showed on four markets.
Position Sizing in Forex: How to Calculate the Right Lot Size
Learn how to calculate position size in forex trading: risk-per-trade formulas, lot size calculators, Kelly criterion, and practical examples for any account size.