Market Structure in Forex: BOS, MSS, CHoCH and Swings Explained
Market structure explained: how to mark HH, HL, LH and LL, tell BOS from MSS and CHoCH, separate internal from swing structure, and use multiple timeframes.
This site contains affiliate links. We may earn a commission if you sign up through our links. How we research
Market structure is the sequence of swing highs and swing lows that price leaves behind. When highs and lows keep rising, the structure is bullish; when they keep falling, it is bearish. A BOS (break of structure) is a candle close beyond the latest swing in the direction of the trend, and an MSS (market structure shift, also called CHoCH, change of character) is the first close beyond a swing against the trend.
Disclosure: OnForex may earn a referral commission from Exness links on this page. This is general education, not investment advice.
Structure is the first thing to mark in the smart money concepts framework, because order blocks, fair value gaps and liquidity sweeps only make sense relative to it. It is also plain price action: you are describing what the market did, not predicting it.
Swings: the building blocks
A swing high is a candle whose high is the highest of the candles around it. A swing low is the opposite. We use a simple rule in our research: a swing is the highest high or lowest low of 3 bars on each side. That is a mechanical definition, so two people get the same marks. On a 1-hour chart this finds swings that last a few hours; a wider window (5 or 10 bars) finds fewer, larger ones.
Label each swing against the one before it:
| Label | Meaning | Read as |
|---|---|---|
| HH (higher high) | A swing high above the previous swing high | Bullish |
| HL (higher low) | A swing low above the previous swing low | Bullish |
| LH (lower high) | A swing high below the previous swing high | Bearish |
| LL (lower low) | A swing low below the previous swing low | Bearish |
An uptrend is a run of HH and HL. A downtrend is a run of LH and LL. If neither pattern holds, price is in a range, and range trading calls for different expectations than trend trading (see trend trading).
BOS, MSS and CHoCH
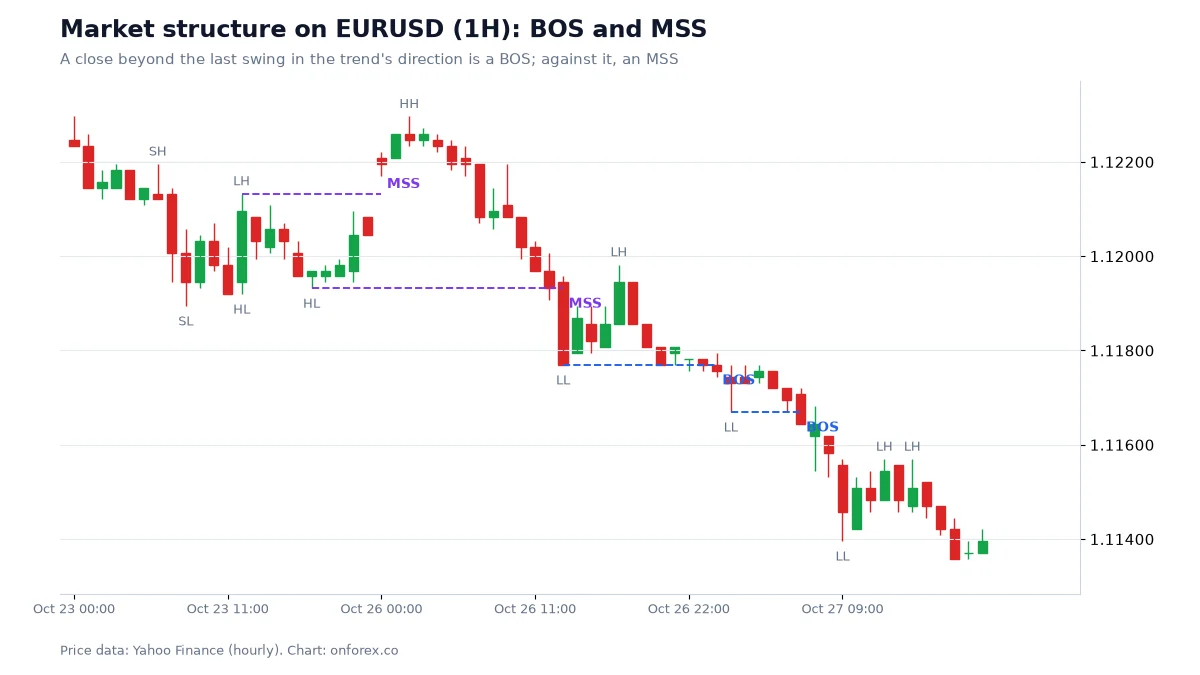
On the chart, price first made higher highs and higher lows. Then a candle closed below the last higher low. That close is the MSS: the rising sequence has failed. After it, price printed lower highs, and each close below the previous low is a BOS, a confirmation that the new direction is continuing.
The rules in one place:
- With the trend, break = BOS. In a downtrend, a close below the last swing low. In an uptrend, a close above the last swing high.
- Against the trend, break = MSS / CHoCH. In a downtrend, a close above the last lower high. In an uptrend, a close below the last higher low.
- Use closes, not wicks. A wick through a level followed by a close back inside is often a liquidity sweep, the opposite of a break.
- A BOS does not mean the move is guaranteed to go on. It tells you the structure is intact.
A note on names: the terms are not standardised. Some teachers say CHoCH for the first break and MSS for a break that also grabbed liquidity first. Others use them interchangeably. Pick one meaning and use it consistently when you review trades.
Internal structure versus swing structure
Every leg contains smaller legs. Swing structure (also called external structure) is the larger series of highs and lows that define the main move. Internal structure is the smaller series inside a single leg, for example the pullbacks within a rally.
- A break of internal structure is early and noisy. It might be nothing more than a pullback ending.
- A break of swing structure is rarer and carries more weight, but you only see it later, so your stop is usually further away.
A practical way to keep them apart: choose two swing windows, such as 3 bars for internal and 10 bars for swing structure, and use different colours. If internal structure turns bullish inside a bearish swing structure, you have a bounce inside a downtrend, not a trend change.
Multi-timeframe structure
Structure on a higher timeframe contains structure on a lower one. A typical use is top-down:
- On the daily or 4H chart, mark the swing structure and decide the bias: bullish, bearish or range.
- On the 1H chart, wait for price to reach an area of interest, such as the discount side of a dealing range or an order block.
- On 15M-1H, look for a lower-timeframe MSS in the direction of the higher-timeframe bias.
When timeframes agree, there is a clean story. When they disagree (4H bearish, 15M bullish), you are looking at a pullback inside a larger move. That is not wrong, but it is a different trade, with different expectations for how far it can run. Many beginners' losses come from taking a 15M BOS against an unbroken 4H trend and treating it as a reversal.
Does a break of structure follow through? Our data
We measured how often a break keeps going. Source: OnForex analysis of hourly prices from Yahoo Finance, January 2024 - October 2026 (gold: June 2024 - October 2026, COMEX gold futures). Swing = highest/lowest of 3 bars each side.
| Share that extended a further 1 ATR before closing back through the level | EURUSD | GBPUSD | USDJPY | XAUUSD |
|---|---|---|---|---|
| BOS | 67.8% | 62.2% | 60.7% | 63.3% |
| MSS | 67.5% | 61.2% | 62.1% | 63.9% |
Roughly 61-68% of breaks travelled another 1 ATR (average true range, a measure of typical candle size) before price closed back through the broken level. That is better than half, but a third or more of breaks did not follow through, and one ATR on 1H candles is a modest distance. MSS and BOS behaved about the same, so a CHoCH is not clearly more or less reliable than a continuation break in this sample.
The takeaway is a modest one: structure breaks tend to continue a bit, which supports using structure as context. It does not support treating a break as an entry signal without an invalidation point and a sensible stop. In the same data, a random entry with a stop of 1 ATR was hit within 24 hours 73-78% of the time, so stops need real room; the stop-loss guide covers placement.
Worked example: marking a down move
Using the EURUSD chart above, here is the process on a clean chart:
- Find the most recent swing high and the swing low that came before it. Draw a line at the swing low that the market is holding above.
- Wait for a candle to close below it. That is the MSS. Do not mark it on a wick.
- Mark the new lower high created by the bounce. Its high is the invalidation level for a bearish view.
- Each time a candle closes under the previous swing low, mark a BOS.
- If a candle closes above the lower high, the bearish structure has failed. Redraw.
You can finish steps 1-5 without placing a trade. Structure is a description. A trade comes from combining it with a level, a stop and a size.
A short checklist before you mark a break
Before you label anything as a BOS or MSS, run through five questions. They take less than a minute and remove most false labels.
- Which timeframe am I on, and what is the higher-timeframe bias?
- Which swing am I breaking, and is it a swing by my written rule (for example 3 bars each side)?
- Did a candle close beyond it, or only a wick?
- Is this break with the trend (BOS) or against it (MSS)?
- Where is the level that would prove this reading wrong, and how far away is it in ATR terms?
If you cannot answer question 5, you cannot size a position, because the stop distance is what turns a risk amount into a lot size. This is the link between reading structure and the rest of your plan: the structure gives you the invalidation level, the stop sits beyond it with room for noise, and the lot size follows from the distance. The lot size guide shows the conversion step by step.
Common mistakes
- Counting wicks as breaks. Always check the close. Wicks beyond a level that return are common around news, when spreads widen and price spikes.
- Using too many swings. If every minor wiggle is a swing, the structure flips constantly. Pick a swing window and keep it.
- Ignoring the higher timeframe. A lower-timeframe MSS inside a strong higher-timeframe trend is often just a pullback.
- Moving the goalposts. Redefining which swing counts after the market moves is hindsight. Mark levels before the next candles appear.
- Skipping the risk plan. Structure tells you where the idea is wrong; use that to set the stop and the size. See risk per trade and position sizing.
What to read next
Once you can mark structure consistently, the other tools slot in: liquidity sweeps (what happens at swing highs and lows), order blocks (the candle behind a break), and fair value gaps (the gap a fast break leaves). For the hours in which breaks tend to occur, see ICT kill zones, and for a broader toolkit see strategies.
Practise on a demo account first
Mark structure, FVGs and stops on a free Exness demo account before you risk money. Forex and CFD trading carries a high risk of loss.
Continue to ExnessForex and CFD trading involves significant risk. You may lose your invested capital.
Risk warning: Forex and CFD trading carries a high risk of loss, and many retail accounts lose money. Statistics here describe past data under our definitions and do not predict future results. Nothing on this page is investment advice.
Related Articles

Dow Theory in Forex: The Six Tenets and How to Read Trends
Dow theory explained for forex: the six tenets in plain language, how to define a trend by highs and lows, and where it fits and fails on currency charts.

Liquidity Sweep Explained: Stop Hunts, BSL and SSL
What a liquidity sweep is, how buy-side and sell-side liquidity form, how a sweep differs from a breakout, and what 1,294 sweeps in our data showed.

Power of Three (AMD): ICT Accumulation, Manipulation, Distribution
ICT Power of Three explained: accumulation, manipulation, distribution, the Judas swing and daily open, with times in UTC and our data on how often it appears.

Forex Slippage Explained: Causes, Types and How to Limit It
What slippage is, why positive and negative slippage happen, which order types are affected, and what you can do to limit it when markets move fast.

Forex Trading Strategies: A Practical Guide (2026)
Trend following, range trading, scalping, swing trading and carry trades explained with entry and exit rules, risk management and how to test a strategy.

Forex vs Stocks: Which Market Should You Trade in 2026?
Comprehensive comparison of forex and stock markets. Liquidity, trading hours, leverage, costs, and volatility compared. Which market suits your trading style and goals?