Power of Three (AMD): ICT Accumulation, Manipulation, Distribution
ICT Power of Three explained: accumulation, manipulation, distribution, the Judas swing and daily open, with times in UTC and our data on how often it appears.
This site contains affiliate links. We may earn a commission if you sign up through our links. How we research
The Power of Three (PO3, or AMD) is an ICT model that describes a trading period in three phases: accumulation (a quiet range), manipulation (a false move that sweeps liquidity) and distribution (the main move in the other direction). It is a way of reading a day, a week or an hourly candle, not a trade signal. In our data from January 2024 to October 2026, the textbook "fake move, then reverse" happened on only about 1 in 4 to 5 of the days when London broke one side of the Asian range.
Disclosure: OnForex may earn a referral commission from Exness links on this page. This is general education, not investment advice.
This guide explains the three phases, the Judas swing and the daily open, shows where each phase usually sits in UTC, and then checks the idea against four markets. It builds on smart money concepts, liquidity sweeps and ICT kill zones. If you want the strategy version of the same idea, see our London breakout guide.
What Power of Three means
The name comes from the three actions a candle or a day appears to make. ICT-style teachers draw one candle and split it into pieces: the open, then a push that creates a wick in one direction, then a body that closes the other way.
| Phase | Short name | What price does | Typical time (UTC) |
|---|---|---|---|
| Accumulation | A | Trades in a tight range, orders build up | Asian session, about 00:00-07:00 |
| Manipulation | M | Breaks one side of that range, then fails | London open, about 07:00-10:00 |
| Distribution | D | Moves the other way and trends | London to New York, about 08:00-16:00 |
The idea is that large players need liquidity to fill big orders. A quiet range leaves stop orders sitting above its high (buy-side liquidity, BSL) and below its low (sell-side liquidity, SSL). Price runs through one side, the stops trigger, and the move then goes the other way. If you are new to the terms, our liquidity sweep page defines them with a chart.
Be clear about what this is. It is a story that fits many charts afterwards. Whether it predicts anything is a separate question, and we test it below.
The three phases in detail
Accumulation: the quiet range
Accumulation is the stretch where price moves sideways. On forex pairs it is usually the Asian session, because EURUSD and GBPUSD are quiet then. In our hourly data the average EURUSD hour in the 22:00-04:00 UTC window has a range of roughly 6.6-8 pips, against about 15 pips at the London open.
Traders mark the high and low of this window and watch them. Nothing tradable happens inside the range for an AMD trader. The range is only a map of where stops probably sit.
Manipulation: the Judas swing
Manipulation is a move that breaks one side of the range and then reverses. ICT calls the version around the London or New York open a Judas swing, after the idea of a betrayal: price appears to commit to one direction, then goes the other way.
For a bullish day the sequence is: price drops below the Asian low (sweeping SSL), closes back inside the range, then rallies. A bearish day is the mirror image: a push above the Asian high (sweeping BSL), a close back inside, then a decline.
The key detail is the close back inside. A wick through the level that closes back inside is a sweep. A candle that closes beyond the range and keeps going is a breakout, which is the opposite story. Telling them apart in real time is hard, and it is the main reason this model is easier to see on past charts than to use live.
Distribution: the real move
Distribution is the trend leg after the false move. Traders look for evidence that manipulation is over, such as a market structure shift, a break of structure (BOS) or a fair value gap in the new direction, and a pullback into an order block. Targets are often the opposite side of the range or the previous day's high or low.
The daily open and where AMD sits in the day
ICT teaches that the daily open matters because price is said to be "manipulated" away from it before the real move. Two definitions are in common use:
| Definition | UTC (northern winter) | UTC (northern summer) |
|---|---|---|
| Midnight New York time | 05:00 | 04:00 |
| FX day rollover (17:00 New York) | 22:00 | 21:00 |
New York time uses daylight saving, and the United States and the United Kingdom change clocks on different dates, so the gap between London and New York shifts by an hour for a few weeks each spring and autumn. Tokyo does not use daylight saving, so Japan Standard Time stays UTC+9 all year.
In our analysis we define a trading day as 22:00 to 22:00 UTC (17:00 New York in winter), the Asian range as 00:00-06:59 UTC and the London window as 07:00-11:59 UTC. These are fixed UTC hours so the data is comparable. They are not the only valid choice.
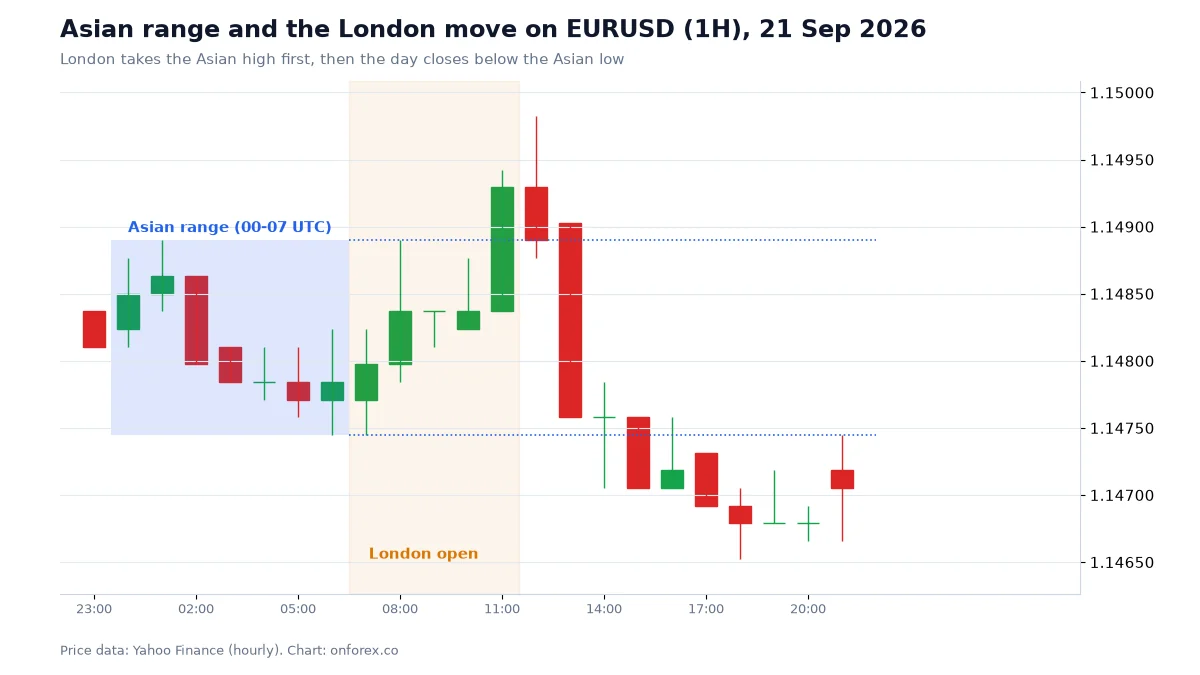
On this day the pattern is clean: a quiet Asian box, a run through the high at London, a reversal and a day that closes below the range. Any single chart like this is easy to find. The useful question is how often it happens.
Our data: how often does AMD appear?
We tested the idea on hourly prices for EURUSD, GBPUSD, USDJPY and gold (XAUUSD). Source: OnForex analysis of hourly prices from Yahoo Finance, January 2024 - October 2026 (gold: June 2024 - October 2026, COMEX gold futures). The sample is 722 trading days for EURUSD and GBPUSD, 721 for USDJPY and 579 for gold.
| What London did to the Asian range | EURUSD | GBPUSD | USDJPY | XAUUSD |
|---|---|---|---|---|
| Took exactly one side | 74.4% | 73.8% | 71.2% | 71.8% |
| Took both sides | 16.9% | 20.1% | 5.4% | 4.7% |
| Took neither | 8.7% | 6.1% | 23.4% | 23.5% |
| Day closed beyond the Asian midpoint on the other side (Judas-style) | 29.2% | 26.5% | 19.1% | 23.3% |
The last row only counts days where London took exactly one side. Reading the table honestly:
- London breaks at least one side of the Asian range on most days. That is volatility, and it is expected.
- A Judas-style reversal (a break, then a close on the other side of the Asian midpoint) occurred on roughly 19-29% of those days. The more common outcome, about 71-81%, was that the day did not reverse.
- On USDJPY and gold, London took neither side on about a quarter of days. Those pairs trade heavily in Tokyo and New York, which probably makes the Asian range less "quiet" than on EURUSD.
So the pattern exists, but it is a minority outcome. A model that is right about 1 day in 4 or 5 is not a reason to assume manipulation on the next breakout.
When do daily highs and lows form?
If AMD were reliable, the daily high or low would often form in the manipulation window and the other extreme later in the day. The table shows where each extreme actually formed.
| Share of days | EURUSD | GBPUSD | USDJPY | XAUUSD |
|---|---|---|---|---|
| Daily high formed 22:00-07:00 UTC | 32.7% | 30.2% | 37.5% | 35.4% |
| Daily high formed 07:00-12:00 UTC | 17.5% | 17.1% | 12.9% | 9.6% |
| Daily high formed 12:00-17:00 UTC | 30.6% | 30.2% | 28.7% | 33.7% |
| Daily low formed 22:00-07:00 UTC | 29.0% | 28.8% | 45.3% | 44.5% |
| Daily low formed 07:00-12:00 UTC | 16.8% | 21.0% | 13.8% | 10.7% |
| Daily low formed 12:00-17:00 UTC | 33.6% | 29.9% | 27.4% | 29.9% |
The remaining share forms between 17:00 and 22:00 UTC. The most common single hours for the EURUSD daily high or low were 13:00 and 14:00 UTC, at about 7-8% of days each. That is the New York open, not London. Extremes are spread across the whole day, and a large share forms during the Asian session itself.
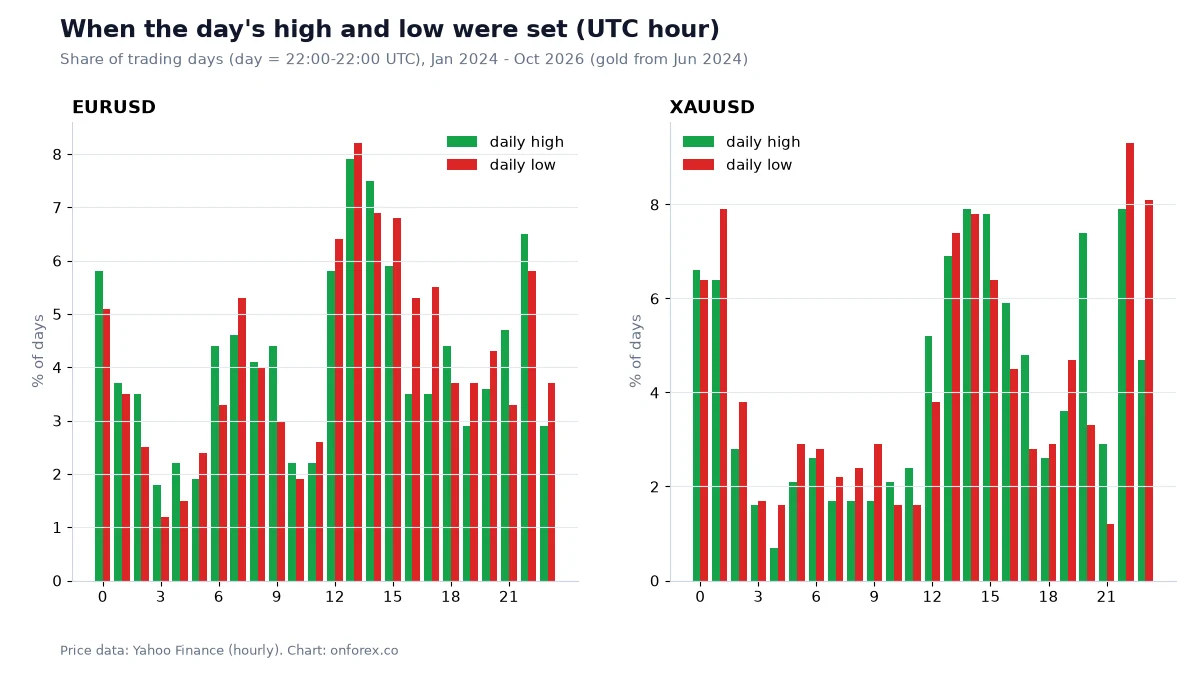
The chart shows that no hour owns the daily extremes. Many traders also expect London to set the high or low, and our data does not support that for these four markets.
How traders use AMD (without a promise)
Treat what follows as a description of a method, not a recommendation. It is the common outline:
- Mark the Asian high and low before London opens.
- Wait for a sweep, meaning a wick beyond one side that closes back inside the range.
- Look for a shift in market structure on a lower timeframe in the opposite direction.
- Plan an entry at an order block or a fair value gap, with a stop beyond the sweep's extreme.
- Aim for the other side of the range or the nearest opposite liquidity, and size the position from the stop distance.
On position sizing: with a USD 1,000 account and 1% risk, you risk USD 10. If the stop is 12 pips on EURUSD, where one pip on a standard lot is about USD 10, the size is 10 / (12 x 10) = 0.08 lots. A stop beyond a sweep wick is often 10-20 pips on EURUSD, so check that the position size still makes sense after the spread. See pip value and lot size for the formula.
Because the fake-out happened on only a minority of days, the only comfortable way to use it is to wait for the sweep and the reversal to show up on the chart first. Entering a "manipulation" before it has reversed is the same as trading a breakout against the move, with a stop right behind it.
Common mistakes
- Calling every breakout a Judas swing. In our data, London breaking one side was far more often continuation. If the candle closes outside the range and stays out, it is a breakout.
- Fading the first move at the open. Spreads widen around the London open and news, and stop orders fill at worse prices than planned (slippage). A tight stop at the open can be hit by the spread and a fast wick alone.
- Ignoring the bigger trend. A bullish sweep of the Asian low in a strong downtrend can be just a pause rather than a reversal; check the larger trend first.
- Using a different "daily open" each day. Pick one definition (midnight New York or the 22:00 UTC rollover) and keep it, or the backtests are meaningless.
- Forgetting daylight saving. The London and New York clocks change on different dates. A window written in UTC drifts against the real session by an hour.
- Treating one clean chart as proof. Our example is real, but days like it are the minority.
Related guides
- Smart money concepts: the full vocabulary behind AMD
- London breakout: the same Asian range, traded as a strategy
- ICT kill zones: session times and hourly ranges
- Liquidity sweep: how a sweep looks and what our data says
- Trading hours: sessions in your time zone
- Risk per trade: sizing a stop that sits beyond a sweep
Practise before you risk money
Practise marking the Asian range and watching London on a free demo account before you risk money.
Practise on a demo account first
Mark the Asian range, sweeps and stops on a free Exness demo account before you risk money. Forex and CFD trading carries a high risk of loss.
Continue to ExnessForex and CFD trading involves significant risk. You may lose your invested capital.
Risk warning: Forex and CFD trading carries a high risk of loss and is not suitable for everyone. The Power of Three is a way of describing past price action. It does not predict the next day, and nothing here guarantees a profit. Data: OnForex analysis of hourly prices from Yahoo Finance, January 2024 - October 2026 (gold: June 2024 - October 2026, COMEX gold futures). Past results do not indicate future results.
Related Articles

Wyckoff Method: Accumulation, Spring and Distribution
Wyckoff method explained: the three laws, accumulation and distribution phases, the Wyckoff spring and upthrust, and how often springs led to markup in our data.
Breaker Block: What It Is and How It Differs From an OB
Breaker block explained: how a failed order block becomes a breaker, breaker vs mitigation block vs order block, how to mark one, and the risks of trading it.

ICT Silver Bullet: Times, Rules and What Our Data Shows
The ICT silver bullet strategy: the 10-11 am New York window, the sweep-and-FVG entry, time zone conversions, and our data on what that hour does.

Premium and Discount in ICT: Dealing Range and OTE
Premium and discount explained: how to mark a dealing range, find equilibrium at 50%, and use the OTE zone (62%, 70.5%, 79%) with a worked example.

Forex Trading Strategies: A Practical Guide (2026)
Trend following, range trading, scalping, swing trading and carry trades explained with entry and exit rules, risk management and how to test a strategy.

Liquidity Sweep Explained: Stop Hunts, BSL and SSL
What a liquidity sweep is, how buy-side and sell-side liquidity form, how a sweep differs from a breakout, and what 1,294 sweeps in our data showed.