ICT Silver Bullet: Times, Rules and What Our Data Shows
The ICT silver bullet strategy: the 10-11 am New York window, the sweep-and-FVG entry, time zone conversions, and our data on what that hour does.

This site contains affiliate links. We may earn a commission if you sign up through our links. How we research
The ICT silver bullet is a time-based setup: during a fixed one-hour window, most often 10:00-11:00 New York time, the trader waits for price to sweep a nearby high or low and then enters on a fair value gap (FVG) that forms in the opposite direction, aiming for liquidity on the other side. It comes from ICT (Inner Circle Trader) teaching. The window is real in the sense that it is one of the busiest hours of the day; whether the setup inside it has an edge is a separate question, and our data can only answer part of it.
Disclosure: OnForex may earn a referral commission from Exness links on this page. This is general education, not investment advice.
This guide explains the window and its versions, converts the times to London, UTC and Tokyo, walks through the steps with a worked example, and then shows what our hourly data says about the 10:00 New York hour on EURUSD, GBPUSD, USDJPY and gold.
The silver bullet windows
ICT defines times in New York local time, which moves with US daylight saving. Three windows are commonly taught:
| Window | New York | London (usual) | UTC, US summer time | UTC, US winter time |
|---|---|---|---|---|
| London open | 03:00-04:00 | 08:00-09:00 | 07:00-08:00 | 08:00-09:00 |
| New York AM (the main one) | 10:00-11:00 | 15:00-16:00 | 14:00-15:00 | 15:00-16:00 |
| New York PM | 14:00-15:00 | 19:00-20:00 | 18:00-19:00 | 19:00-20:00 |
US summer time runs from the second Sunday of March to the first Sunday of November. The UK changes on the last Sundays of March and October, so for about three weeks a year (two in spring, one in autumn) the London column is one hour earlier than shown. In Tokyo (no daylight saving), the main window is 23:00-24:00 in US summer and 00:00-01:00 in US winter. In India (IST) it is 19:30-20:30 in US summer and 20:30-21:30 in winter.
Always check which time zone your chart is set to. Many brokers' servers are on neither New York nor UTC time.
The idea behind the setup
The silver bullet combines three pieces that appear elsewhere in SMC/ICT teaching:
- Liquidity. Stop orders tend to cluster just beyond obvious highs and lows: buy stops above highs (buy-side liquidity, BSL) and sell stops below lows (sell-side liquidity, SSL). See liquidity sweep.
- Displacement and an FVG. A strong, fast move leaves a fair value gap: a three-candle pattern where the wicks of candles 1 and 3 do not overlap. The gap is treated as a place price may return to.
- Time. The window narrows when you look. It sits inside the New York part of the ICT kill zones, after the 08:30 New York US data releases and at the time of the 10:00 releases.
The story is that the first hour or two of New York trading builds a range, the 10:00 hour runs the stops on one side of it, and the real move then goes the other way. That story is testable at least in part, which we do below.
Step by step
- Before 10:00, mark the liquidity. The high and low of the early New York session (08:00-09:59), the London session high and low, and the previous day's high and low. These are the levels a sweep would take.
- Check the calendar. Know whether US data is due at 08:30 or 10:00 New York. Spreads widen and price can jump around those times. See economic calendar.
- Inside the window, wait for a sweep. Price trades beyond one of the marked levels and then turns back. A sweep is defined by price returning, not by the poke alone.
- Look for displacement and an FVG in the opposite direction on a 1 to 5 minute chart.
- Enter on a return into the FVG, often at its 50% level (the consequent encroachment, CE).
- Stop beyond the sweep extreme, plus a buffer for spread.
- Target the opposite liquidity, for example the other side of the early New York range. If that is less than about 2R away, many traders pass.
- If nothing qualifies by 11:00, do nothing.
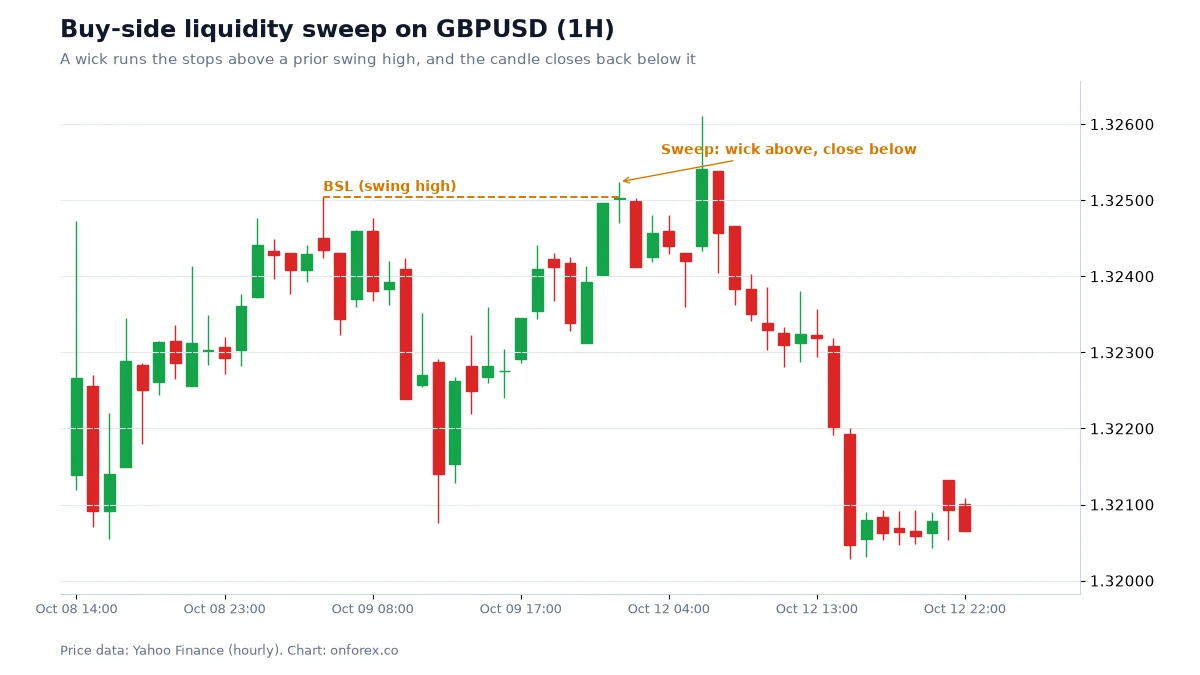
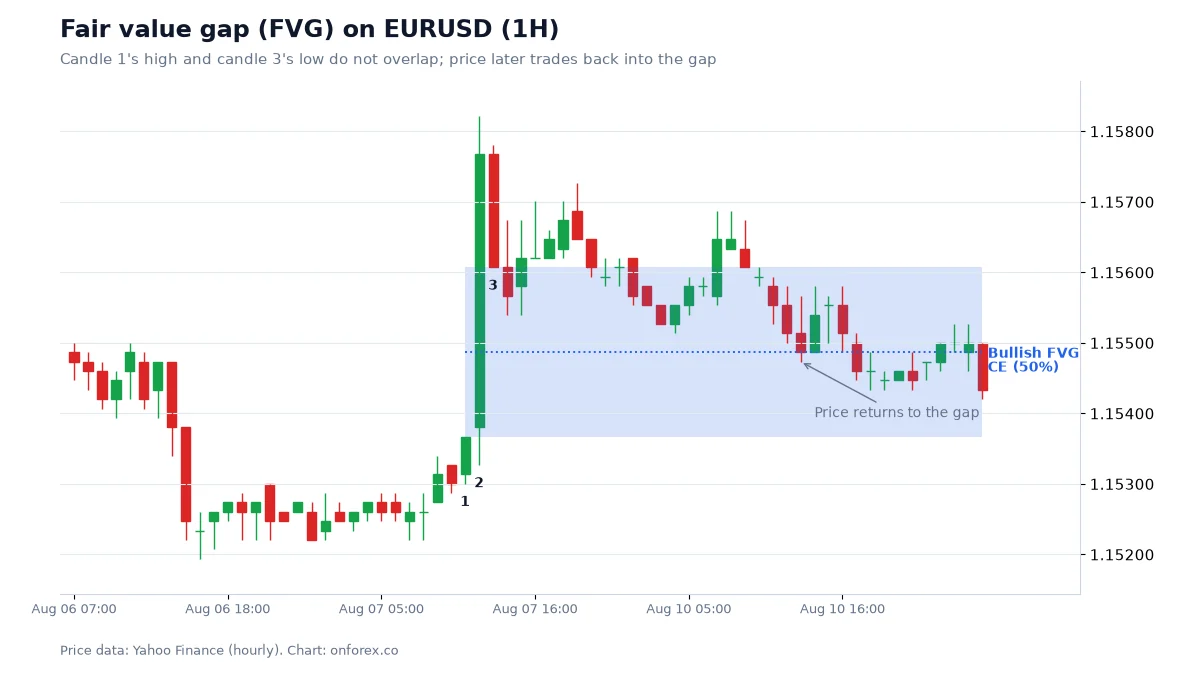
On these hourly charts the pieces are easy to see. On a 1-minute chart they are far more frequent, which is why the time filter matters: without it you would see dozens of "sweeps and FVGs" a day.
Worked example (illustrative numbers)
EURUSD, US winter time. From 08:00 to 09:59 New York the range is 1.0820-1.0850.
- At 10:12 New York, price spikes to 1.0856, six pips above the range high, and quickly falls back inside the range. That is a sweep of buy-side liquidity.
- The drop leaves a bearish FVG on the 5-minute chart between 1.0849 and 1.0843. Its CE is 1.0846.
- The trader places a sell limit at 1.0846, with the stop at 1.0859 (3 pips above the sweep high). Risk = 13 pips.
- Target: the early-session low at 1.0820, 26 pips away, which is 2R.
Position size on a USD 1,000 account risking 1% (USD 10): EURUSD pip value per standard lot is USD 10, so 10 / (13 x 10) = 0.077 lots, rounded down to 0.07 lots. If the spread widens to 2 pips at a 10:00 release, that is about 15% of a 13-pip stop, which is why tight-stop setups are most sensitive to costs. See position sizing and risk-reward ratio.
Our data: what does the 10:00 New York hour actually do?
Limits first. The silver bullet is defined on 1 to 5 minute charts. We use hourly bars, so we cannot test the full entry (sweep, FVG, CE fill, stop, target). We can test what the hour itself does and whether the "raid, then reverse" story holds at the hourly level. All times below are New York local time, adjusted for daylight saving.
It is one of the most active hours
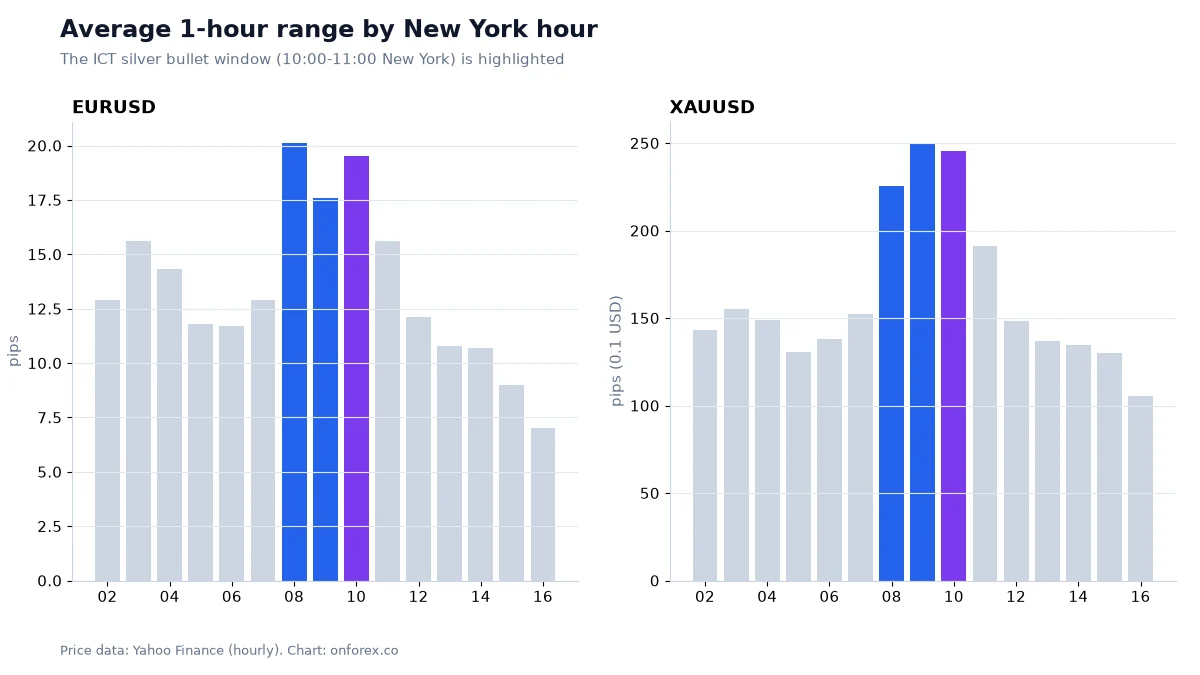
| EURUSD | GBPUSD | USDJPY | XAUUSD | |
|---|---|---|---|---|
| Average range of the 10:00 hour | 19.5 pips | 24.2 pips | 34.4 pips | USD 24.5 |
On EURUSD, the 10:00 hour averages 19.5 pips, next to 08:00 (20.1) and 09:00 (17.6), while quiet hours are about 7 to 12 pips. The chart shows the same picture for gold: 08:00 to 10:00 is the busiest block, and the range drops off after 11:00. So the window does pick an hour where price moves.
It often takes one side of the early range
| EURUSD | GBPUSD | USDJPY | XAUUSD | |
|---|---|---|---|---|
| 10:00 hour traded beyond exactly one side of the 08:00-09:59 range | 70.3% | 73.1% | 67.5% | 68.3% |
| Of those days: 16:00 close back on the other side of the 10:00 open | 35.0% | 34.4% | 31.5% | 33.9% |
| 10:00 hour printed the high or low of the 08:00-16:00 session | 31.6% | 28.6% | 26.2% | 29.9% |
Source: OnForex analysis of hourly prices from Yahoo Finance, January 2024 - October 2026 (gold: June 2024 - October 2026, COMEX gold futures).
How to read this:
- The raid is common. On about 7 days in 10, the 10:00 hour broke exactly one side of the early New York range. That is what a busy hour following a two-hour range would do, so on its own it says little.
- The reversal is not. When that happened, the market closed the day (16:00 New York) back on the other side of the 10:00 open only 31-35% of the time. On the other two-thirds of days, the close stayed on the side of the raid. At the hourly level, a 10:00 break was more often continuation than a stop hunt.
- The hour is only slightly special for the session extreme. With eight hours in the 08:00-16:00 session, an hour chosen at random would hold the session high or low roughly a quarter of the time. The 10:00 hour did so 26-32% of the time: a little more, not dramatically more.
The fair conclusion: the silver bullet window is a reasonable place to concentrate attention because it is active, but "price took the early high, so it will reverse" is not a signal by itself. Any edge would have to come from the lower-timeframe details (which sweeps qualify, which FVGs, which targets), and those need your own testing. Our liquidity sweep data on hourly swings tells a similar story: 50-55% of sweeps ended up on the reversal side 12 hours later.
Practical points
- Costs scale with tight stops. A 10-pip stop and a 1-pip spread means 10% of your risk is spent before price moves. Check your account's typical spread at 10:00 New York, not at a quiet hour.
- News at 10:00. Several US releases come out exactly at 10:00 New York. The first minutes after a release can produce sweeps that are just the news spike. Some traders skip the window on those days.
- Slippage on stops. In fast markets a stop order can fill beyond its price. A planned 1R loss can become larger.
- One or two trades. A fixed window naturally limits the number of trades. Keep it that way; it is the main protection against overtrading. See trading psychology.
- Record every window, including the ones without a setup, so you can measure whether your version beats simply not trading. See backtesting.
Common mistakes
- Wrong clock. Using UTC or server time and forgetting the daylight-saving shift. For a one-hour window, a one-hour error means trading the wrong hour entirely.
- Calling every wick a sweep. Price must return inside the level, and the level should be one other traders can see.
- Entering on the sweep itself, before any displacement or FVG shows the turn.
- Stops inside the noise. A stop just above the FVG rather than beyond the sweep extreme is hit by normal 1-minute movement.
- Stretching the window. Taking a setup at 11:20 "because it is almost the same" turns a time rule into no rule.
- Assuming the reversal. Our data says the raid was followed by a reversal close only about a third of the time.
Related guides
Smart money concepts, market structure, order block, power of three, London breakout, scalping strategy, day trading, trading hours and stop-loss.
Practise on a demo account first
Mark structure, FVGs and stops on a free Exness demo account before you risk money. Forex and CFD trading carries a high risk of loss.
Continue to ExnessForex and CFD trading involves significant risk. You may lose your invested capital.
Risk warning: Forex and CFD trading carries a high risk of loss and is not suitable for everyone. You can lose more than you deposit in some cases. The statistics on this page come from historical data under our own definitions and do not predict future results. This page is general education and not investment advice.
Related Articles

ICT Kill Zones: London, New York and Asia Times (UTC) With Data
ICT kill zones explained with times in UTC and New York time, how daylight saving shifts them, and our hourly range data for EURUSD, GBPUSD, USDJPY and gold.

Forex Trading Hours: Market Sessions in Your Local Time (2026)
Forex trading hours in GMT and local time for New York, London, Tokyo, Sydney, Dubai, Lagos, Nairobi, Mumbai, Manila, Jakarta and Kuala Lumpur, plus DST notes.
London Breakout Strategy: Asian Range Rules, Times and Data
London breakout strategy explained: how to mark the Asian range, entry, stop and target variants, false breakouts, UTC and JST times, and our data on four markets.

Breakout Trading Strategy: How to Trade Forex Breakouts
Master forex breakout trading in 2026. Learn how to identify real breakouts, filter false breaks with volume, and apply precise entry and exit rules to capture big moves.

Swing Trading Forex: Strategy, Holding Time and Our Data
Swing trading forex explained: how long swings last, how big they are in pips, a step-by-step swing trading strategy, swap and weekend risk, and sizing.

Premium and Discount in ICT: Dealing Range and OTE
Premium and discount explained: how to mark a dealing range, find equilibrium at 50%, and use the OTE zone (62%, 70.5%, 79%) with a worked example.