Swing Trading Forex: Strategy, Holding Time and Our Data
Swing trading forex explained: how long swings last, how big they are in pips, a step-by-step swing trading strategy, swap and weekend risk, and sizing.

This site contains affiliate links. We may earn a commission if you sign up through our links. How we research
Swing trading is a style in which you hold a position for one or more price swings, typically from about a day to two weeks, to capture the move between a swing low and a swing high. In our 4-hour data, the median swing on EURUSD was 82 pips and lasted 1.5 days. That puts swing trading between day trading, where everything closes before the end of the day, and long-term position trading.
Disclosure: OnForex may earn a referral commission from Exness links on this page. This is general education, not investment advice.
This guide covers what a swing is, how long and how big swings were in four markets, a step-by-step swing trading strategy, the costs that only appear when you hold overnight, and how to size a position with a wider stop.
What is a swing?
A swing high is a peak with lower highs on both sides. A swing low is a trough with higher lows on both sides. A swing leg is the move from one to the next. In an uptrend, the legs up are longer than the legs down (higher highs and higher lows). In a downtrend it is the other way round. This is the basis of market structure and Dow theory.
A swing trader tries to enter near the end of a counter-trend leg and exit near the end of the next trend leg. You will rarely catch the exact low or high, and you do not need to. Catching the middle of a leg is enough if the stop is placed sensibly.
For this guide we defined swings mechanically on the 4-hour chart: a swing high is the highest high of five bars on each side, a swing low the lowest low, and highs and lows must alternate.
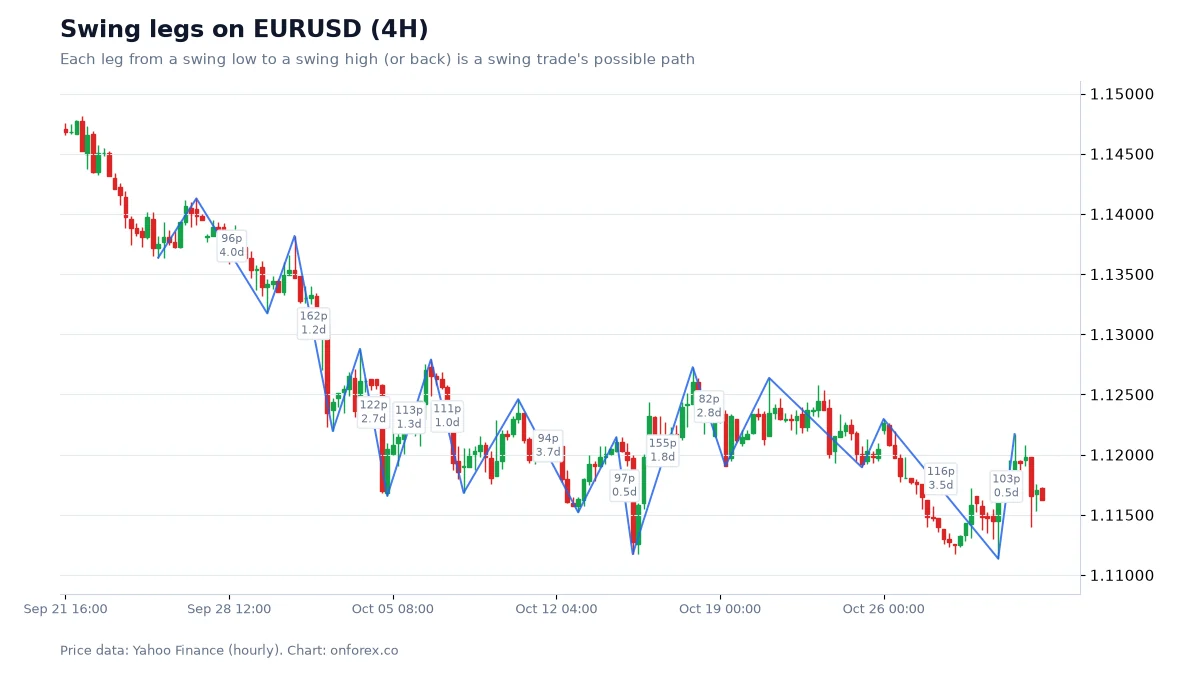
The chart shows a downtrend from about 1.147 to 1.112. The labelled legs ranged from 82 to 162 pips and from half a day to four days. Two things stand out. First, swings vary a lot, so a fixed profit target in pips fits some legs and not others. Second, the up legs inside the decline were the pullbacks a swing seller would wait for.
Our data: how long and how big are swing legs?
We measured every swing leg on the 4-hour chart with the definition above.
| Market | Swing legs | Median length | Median size | Middle half of sizes |
|---|---|---|---|---|
| EURUSD | 485 | 1.5 days | 82 pips | 58 - 124 pips |
| GBPUSD | 480 | 1.7 days | 102 pips | 74 - 149 pips |
| USDJPY | 456 | 1.5 days | 165 pips | 112 - 248 pips |
| XAUUSD | 366 | 1.7 days | USD 98 | USD 59 - 150 |
Source: OnForex analysis of hourly prices from Yahoo Finance, January 2024 - October 2026 (gold: June 2024 - October 2026, COMEX gold futures); 4-hour bars are resampled from hourly. The middle half of leg lengths was 0.8 to 3.3 days across markets.
What this means in practice:
- A swing trade usually stays open overnight. With a median leg of 1.5 to 1.7 days, most trades that try to catch a full leg will be held through at least one rollover.
- Targets in the tens of pips are day-trade targets. A typical EURUSD leg was 82 pips, and the middle half ran from 58 to 124 pips. A 20-pip target on the 4-hour chart takes only a small part of the move.
- Stops have to be wide enough for the swing. If the leg itself is about 80 pips, a 10-pip stop sits inside normal noise.
- USDJPY and gold move further in their own units. Compare markets with ATR (average true range, a measure of typical bar size), not raw pips. See ATR indicator.
Swing trading vs day trading vs scalping
| Scalping | Day trading | Swing trading | |
|---|---|---|---|
| Holding time | Seconds to minutes | Minutes to hours, closed the same day | About 1 day to 2 weeks |
| Main charts | 1-5 minute | 15 minute - 1 hour | 4 hour - daily |
| Typical stop | A few pips | Tens of pips | Wider, set beyond a 4H or daily swing |
| Number of trades | Many per day | A few per day | A few per week or month |
| Screen time | High, at fixed hours | Several hours a day | Short checks once or twice a day |
| Main costs | Spread on every trade | Spread, slippage at news | Swap each night, weekend gaps |
For the other styles, see scalping strategy and day trading. Swing trading suits people who cannot watch the market all day, which is one reason it is popular with traders who have a job.
A swing trading strategy, step by step
This is a framework, not a system with a proven edge. Write your own version down and test it before using it.
1. Find the trend on the daily or 4-hour chart
Mark the last few swings. Rising highs and lows mean an uptrend, falling ones a downtrend. A moving-average filter (for example the 20 EMA above the 50 EMA) can help you stay consistent. See moving averages and trend trading. If you cannot tell, it is probably a range, and range trades need different rules.
2. Mark the levels that matter
Note the last swing high and low, clear support and resistance, and zones such as supply and demand zones. These tell you where a pullback might stop and where the next leg might run into trouble.
3. Wait for a pullback
In an uptrend, wait for a counter-trend leg towards a level: a rising EMA, a Fibonacci retracement, or a former resistance that is now support.
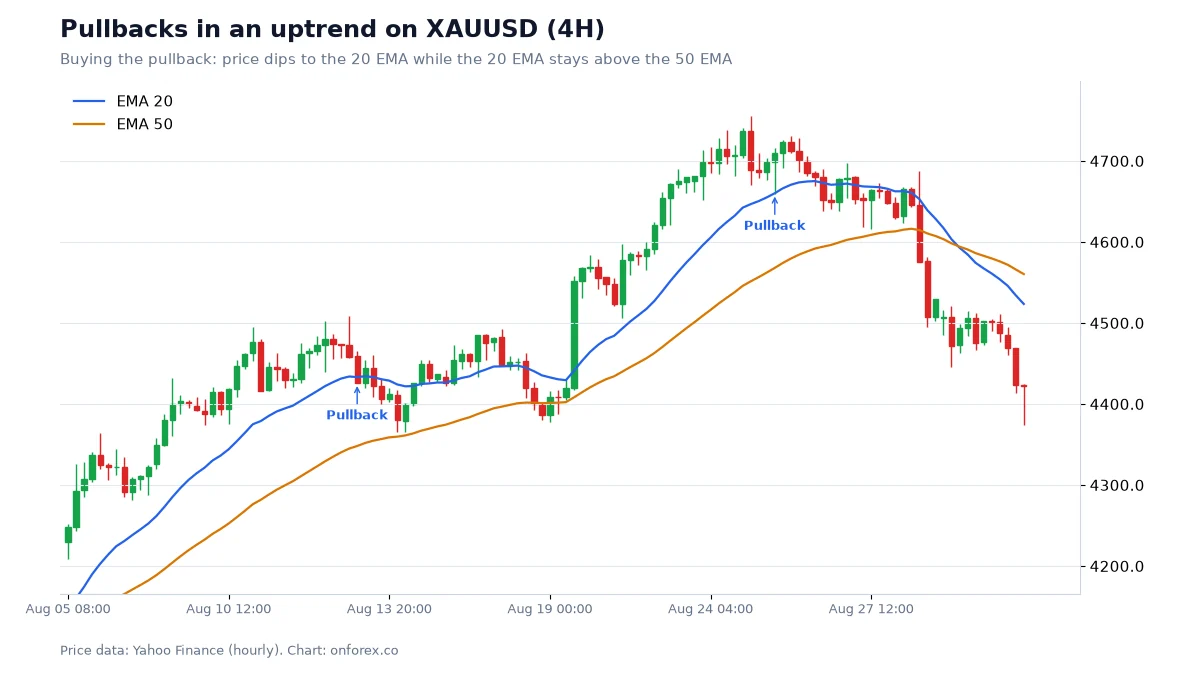
The gold chart shows both sides of the idea. The first marked pullback on about 13 August was followed by a new leg up of several hundred dollars. The second, around 25 August, was not: price later fell through both averages. You cannot tell in advance which pullback is the last one. That is why the stop matters. Our guide to pullback trading has data on 20 EMA pullbacks.
4. Time the entry on a lower timeframe
Many swing traders drop to the 1-hour chart and wait for a sign that the pullback is ending, such as a break of the small down structure inside the pullback, or a clear rejection candle at the level. This is multi-timeframe analysis. It can tighten the stop, but it also means some trades are missed.
5. Place the stop beyond the swing
The stop goes where the idea is wrong: below the pullback low in an uptrend, plus a buffer. ATR helps size the buffer. Our random-entry test on hourly data found that a stop 1 ATR away was hit within 24 hours in 73% to 78% of cases, and a 2 ATR stop in 51% to 56%, even with no edge in the entry. Swing stops need room.
6. Size the position from the stop
Risk a fixed share of the account, then calculate the lot size from the stop distance. See position sizing and risk per trade.
7. Plan the exit
Common choices: the previous swing high, a fixed multiple of the risk (for example 2R), or a trailing stop behind each new higher low. Because legs vary so much in size, many swing traders take part of the position off at the first target and trail the rest.
A worked example (illustrative numbers)
These numbers are made up to show the arithmetic. They are not from the charts above.
EURUSD is in a 4-hour uptrend. Price pulls back to a former resistance at 1.1050, and a 1-hour candle closes back above it. The trader buys at 1.1060. The pullback low is 1.1018. With a buffer of about 0.2 ATR, the stop goes at 1.1010, which is 50 pips away. The last swing high is 1.1160, 100 pips above the entry, so the reward-to-risk is 2:1.
Sizing: on a USD 1,000 account, 1% risk is USD 10. On EURUSD, one standard lot is worth about USD 10 per pip. The size is 10 / (50 x 10) = 0.02 lots. A day trade with a 15-pip stop and the same USD 10 risk would be 0.06 lots. The wider stop does not mean more risk; it means a smaller position. See lot size and pip value.
The target is close to the median EURUSD leg in our data (82 pips), so it is a realistic distance for one swing, not a guess at a big trend move. Check the risk-reward ratio before every trade: with a 2:1 target, the break-even win rate before costs is 33%.
The costs of holding overnight
Swap
A position that is open at the daily rollover (usually 17:00 New York time) is charged or credited a swap, based on the interest-rate difference between the two currencies and the broker's terms. It can be positive or negative, and it is usually tripled once a week to cover the weekend. On a one-day trade it is small. On a trade held for two weeks it can matter, especially on gold and on pairs with a large rate gap. See swap and carry trade.
Weekend gaps
The forex market closes on Friday evening and reopens on Sunday evening (New York time). News over the weekend can make the first price on Sunday very different from Friday's close. A stop-loss is not guaranteed in a gap: it is filled at the next available price, which can be well beyond your stop. This is called slippage. Spreads are also often wider right after the open. Some swing traders reduce size or close positions before the weekend for this reason.
News
A swing trade will often be open through major data such as central bank decisions or employment reports. Check the economic calendar before you enter, and decide in advance whether you will hold through the event.
Common mistakes
- Using day-trade stops on swing charts. A 10-pip stop below a 4-hour swing is usually hit by normal movement.
- Not adjusting the lot size. A wider stop with the same lot size is a bigger risk. Always calculate size from the stop.
- Ignoring swap. A small daily charge adds up over a two-week hold, and the weekly triple swap is easy to forget.
- Watching the 5-minute chart all day. Swing trades are planned on higher timeframes. Constant checking leads to closing too early or moving the stop.
- Expecting every leg to be big. Swings vary widely. Plan the trade on the median, not on the best leg you have seen.
- Holding a losing trade "because it is a swing trade". The stop defines the idea. If it is hit, the swing failed.
Next steps
Pick one market and one timeframe, mark the swings on the last three months, and note how far each leg ran and how long it took. Compare your notes with the table above. Then practise the full routine, from the trend check to the stop and lot size, on a demo account. Related guides: price action, strategies, money management and trading psychology.
Practise on a demo account first
Mark structure, FVGs and stops on a free Exness demo account before you risk money. Forex and CFD trading carries a high risk of loss.
Continue to ExnessForex and CFD trading involves significant risk. You may lose your invested capital.
Risk warning: Forex and CFD trading carries a high risk of loss and is not suitable for everyone. You can lose more than you deposit in some cases. Holding positions overnight and over weekends adds swap costs and gap risk. Past patterns do not predict future results. This page is general education and not investment advice.
Related Articles
Moving Averages in Forex: SMA, EMA, 200-Day Data
Moving averages in forex: SMA vs EMA formulas, 50/200 golden and death crosses, common periods, and what 9 years of daily data show about the 200-day line.

ICT Silver Bullet: Times, Rules and What Our Data Shows
The ICT silver bullet strategy: the 10-11 am New York window, the sweep-and-FVG entry, time zone conversions, and our data on what that hour does.
Forex Day Trading Guide 2026: Sessions, Setups and Risk
A practical guide to forex day trading: which sessions to trade, entry and exit rules, position sizing, and the mistakes that most often cost day traders money.

Forex Scalping Strategy: How to Scalp, Step by Step
How to scalp forex: a step-by-step scalping strategy with a worked example of pip value, spread cost and lot size, plus sessions in GMT and risk limits.
Support and Resistance in Forex: How to Draw and Trade Levels
How to draw support and resistance zones in forex, with a worked EURUSD chart and our own test of prior-day highs, lows and round numbers on 4 markets.
ADX Indicator: Settings, +DI/-DI and What Our Data Shows
ADX indicator guide: how ADX and +DI/-DI are calculated, what 20, 25 and 40 mean, how to use ADX to pick a method, and what our data shows on four markets.