Pullback Trading: Buy Dips and Sell Rallies in a Trend
Pullback trading explained: EMA, Fibonacci and structure pullbacks, telling a dip from a reversal, a worked example, and what our 4-hour data showed.
This site contains affiliate links. We may earn a commission if you sign up through our links. How we research
Pullback trading means joining an existing trend after a temporary move against it: buying a dip in an uptrend, or selling a rally in a downtrend. The idea is to enter at a better price than chasing the move. The hard part is that a pullback and the start of a reversal look the same until it is over, so the stop and the position size matter more than the entry.
Disclosure: OnForex may earn a referral commission from Exness links on this page. This is general education, not investment advice.
This guide explains how to confirm a trend, three ways to define a pullback zone (moving average, Fibonacci and structure), how to tell a pullback from a reversal, and what our own 4-hour data showed about 20 EMA pullbacks.
What is a pullback?
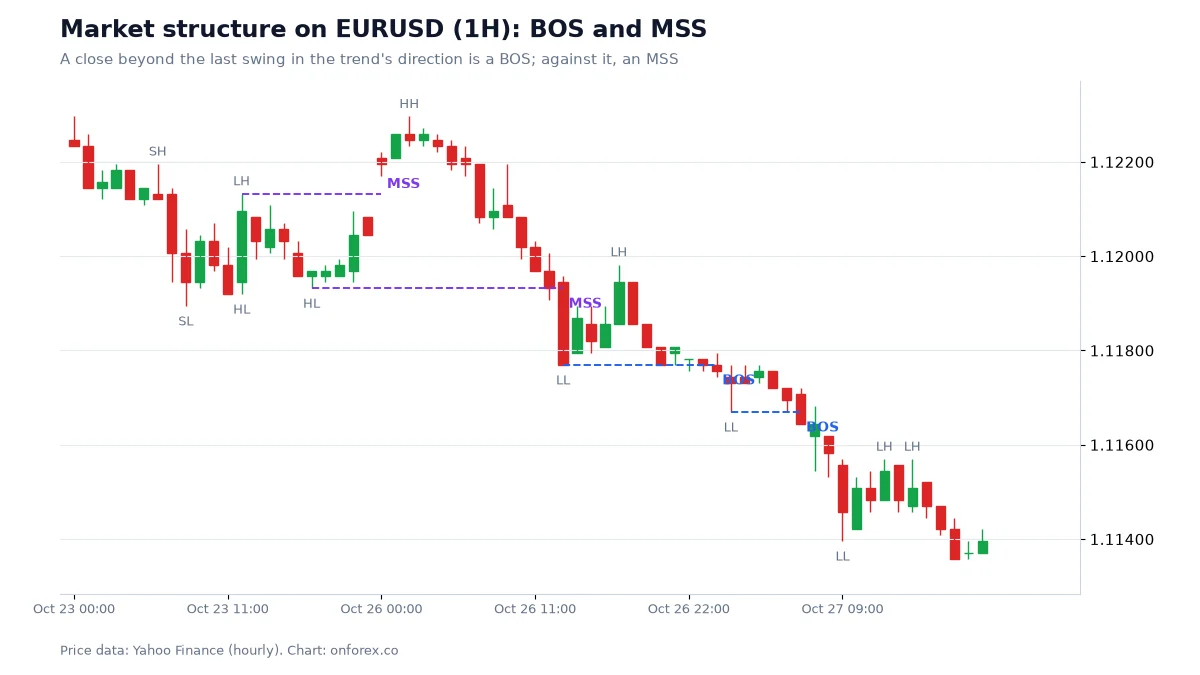
A trend in this guide means a sequence of higher highs and higher lows (uptrend) or lower highs and lower lows (downtrend). A pullback is the counter-move between two pushes in the trend. In an uptrend it is the dip after a higher high that stops above the previous higher low. In a downtrend it is the rally after a lower low that stops below the previous lower high.
The same move has other names. A retracement is a pullback measured as a share of the swing before it. A retest is a return to a level that price has just broken. Both are described in our guides to Fibonacci and support and resistance.
Pullback trading is a core part of trend trading. If you have not marked swings before, start with market structure.
Step 1: confirm there is a trend
You cannot buy a pullback if there is nothing to pull back from. Use one simple definition and stick to it:
- Structure: the last two swing lows are rising and the last two swing highs are rising (or the reverse for a downtrend).
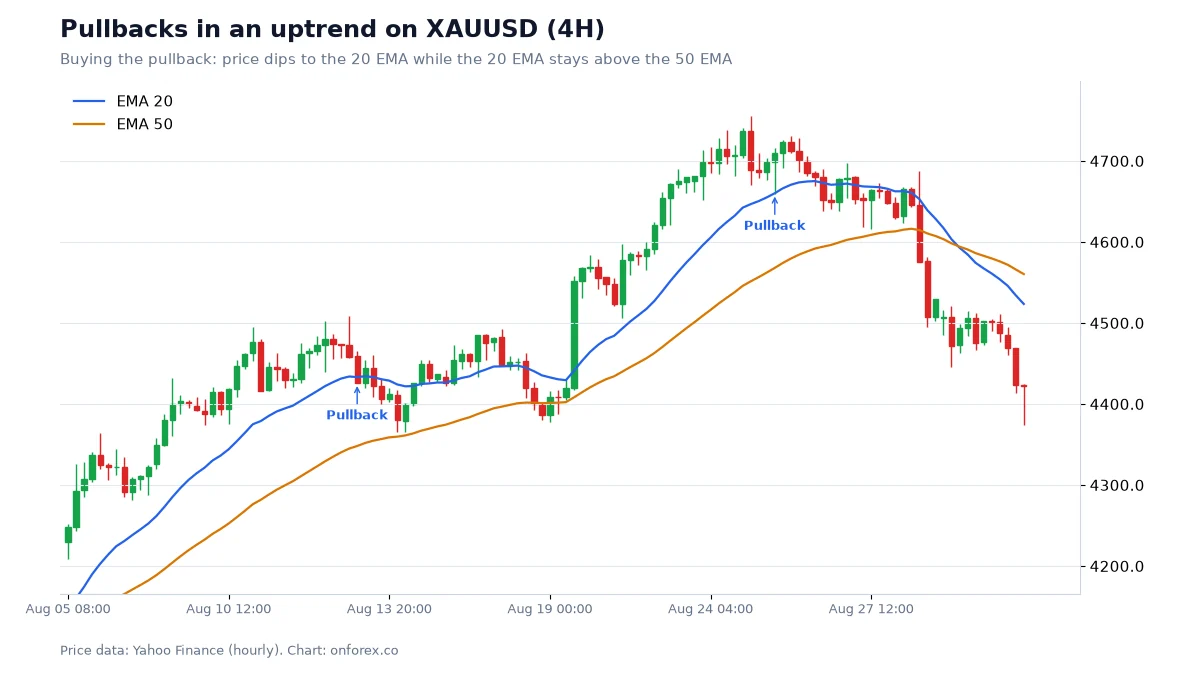
- Average: price is on the right side of a slower moving average, such as the 50 EMA, and the faster average is above it (uptrend). An EMA (exponential moving average) weights recent prices more heavily. See moving averages.
- Higher timeframe: check that a 4-hour or daily chart does not point the other way.
A trend that you must squint to see is not a trend.
Step 2: choose how you define the pullback zone
EMA pullback
Price dips towards a rising 20 or 50 EMA. The 20 EMA is a shallow zone, and the 50 EMA is a deeper one. This approach adapts as the trend moves and is simple to read. It also keeps signalling in sideways markets, where the averages flatten and cross.
Fibonacci pullback
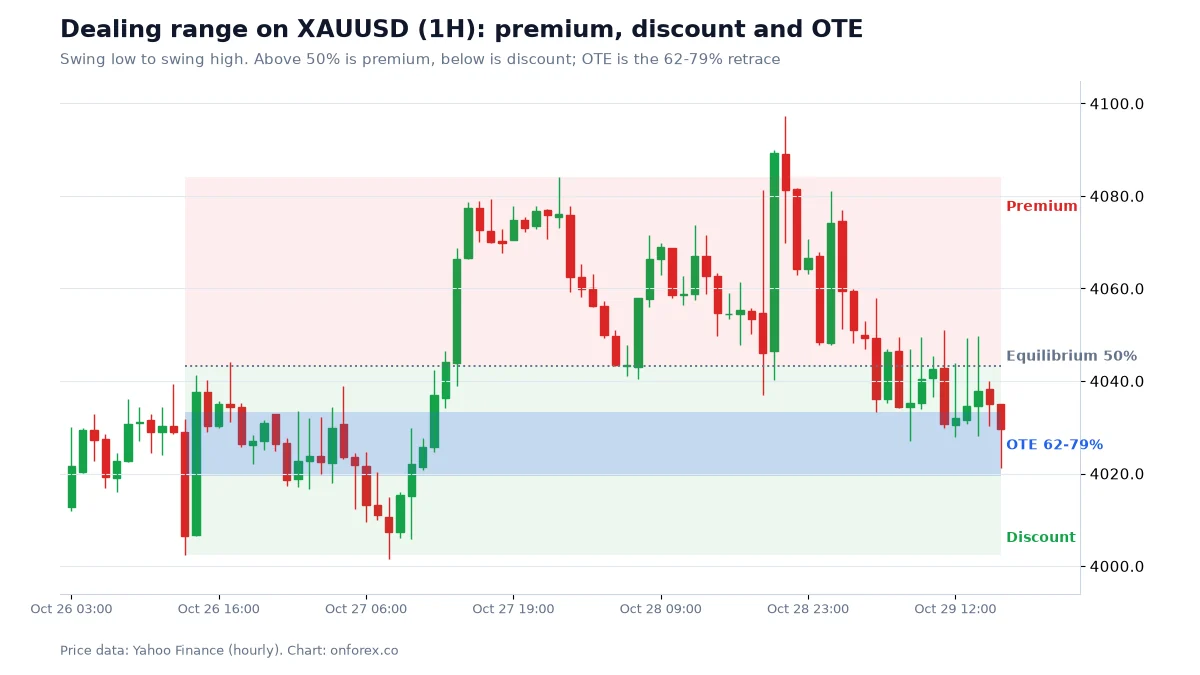
Measure the last swing from low to high (in an uptrend) and look at how much of it price gives back. Common levels are 38.2%, 50% and 61.8%. Some traders focus on the 62% to 79% band called the OTE (optimal trade entry) in ICT-style charting; see premium and discount. Fibonacci gives fixed zones that you can place in advance, but every swing choice changes the levels.
Structure pullback
Price dips to a level that mattered before: the previous swing high that was broken (now support), an order block, or a fair value gap. This is the most flexible approach and the hardest to test, because "a level that mattered" has many definitions.
| Method | Strength | Weakness |
|---|---|---|
| EMA | Adapts to the trend; easy to automate | Whipsaws in ranges; lags |
| Fibonacci | Fixed zone before the dip happens | Depends on swing choice |
| Structure | Based on actual price history | Subjective; hard to test |
None of these is proven best. Pick one, write the rule down, and test it before you use it.
Step 3: wait for evidence that the dip is ending
Entering when price merely touches the zone is entering blind. Common confirmations:
- A rejection candle (a long lower wick, or an engulfing candle) at the zone. See candlestick patterns.
- A close back in the direction of the trend on a lower timeframe, such as a break of the minor swing high that formed during the dip.
- A momentum reading that turns back with the trend. Our divergence guide covers one version of this and its limits.
Waiting costs you the best price sometimes. It also avoids many entries that were simply the first leg of a reversal.
Step 4: place the stop where the trend would be broken
The stop belongs beyond the last swing that defines the trend: below the last higher low in an uptrend, above the last lower high in a downtrend. Add a buffer for the spread and for slippage. Spreads widen around news and the daily open, and a stop order can fill at a worse price than you set.
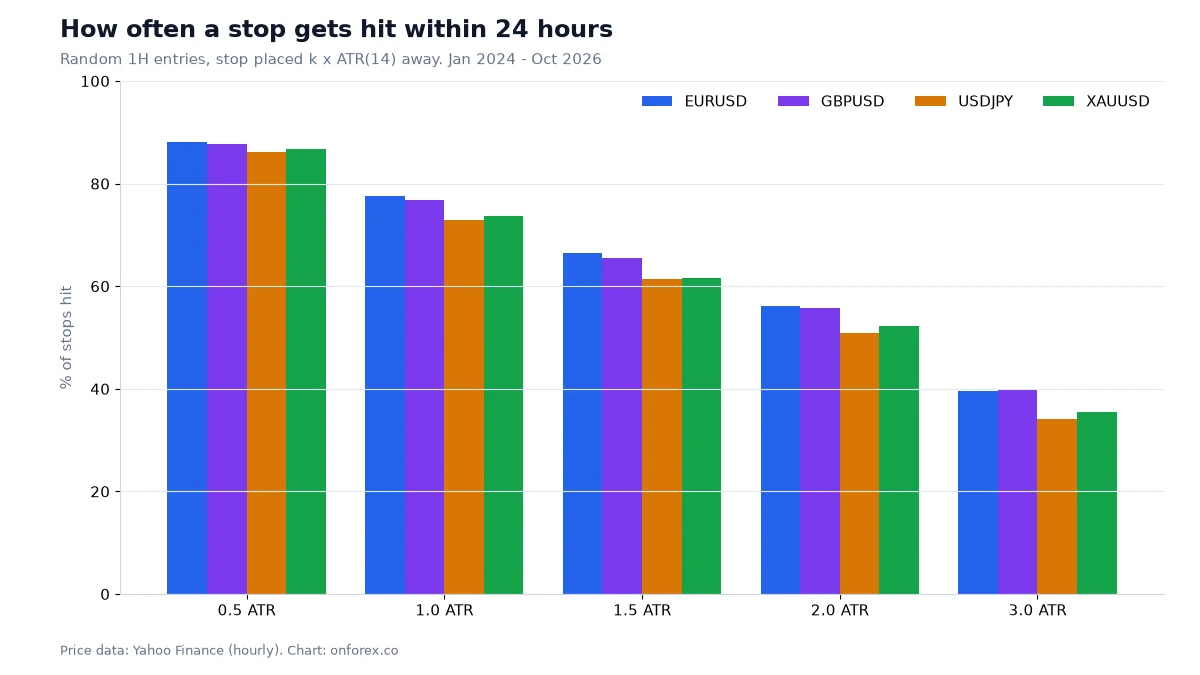
A stop only a few pips beyond a moving average is common and is usually too tight. Our test of random entries found that, in hourly data, a stop 0.5 ATR away was hit within 24 hours about 86% to 88% of the time, and a stop 2 ATR away about 51% to 56%. ATR is the average true range, a measure of typical bar size.
A worked example (illustrative numbers)
These numbers are made up to show the arithmetic. They are not from the charts above.
EURUSD is in a 4-hour uptrend. The last swing low is 1.1000, and price made a high at 1.1100. It then pulls back to the 20 EMA at 1.1052 and prints a bullish rejection candle. The trader buys at 1.1055. The stop goes below the last higher low at 1.1000, minus a 3-pip buffer, at 1.0997. That is 58 pips of risk. A target at the previous high of 1.1100 is only 45 pips away, which is under 1R, so this setup does not pay. The trader either skips it or looks for a target beyond the high, such as 2R at 1.1171, which requires a new high.
Sizing: on a USD 1,000 account risking 1% (USD 10), the size is 10 / (58 x 10) = 0.017 lots, which rounds down to 0.01. If the account cannot size small enough, the trade is too big for it. The arithmetic of risk-reward ratio and position sizing decides whether the trade is worth taking before any chart pattern does.
When a pullback becomes a reversal
You cannot know in advance. You can define in advance what you will treat as a failure:
- A close beyond the last swing that defines the trend. In an uptrend, a close below the last higher low is a break of structure against the trend (an MSS in SMC terms).
- The pullback is deeper and faster than previous ones. Not proof, but a flag.
- A key higher-timeframe level sits above (in an uptrend). The dip may be a rejection of that level.
- Major news. Events can break a trend without warning.
If your stop sits at the failure point, a reversal is a planned loss of 1R. If it does not, a reversal is a surprise.
Our data: pullbacks to the 20 EMA on the 4-hour chart
We tested a simple version. In a 4-hour uptrend (20 EMA above the 50 EMA and the close above the 50 EMA), we took the first touch of the 20 EMA after price had been at least 5 bars away from it. We then asked whether price made a new high before it closed below the 50 EMA.
| Market | First touches (cases) | New high before a close below the 50 EMA |
|---|---|---|
| EURUSD | 85 | 40.0% |
| GBPUSD | 73 | 52.1% |
| USDJPY | 107 | 59.8% |
| XAUUSD | 76 | 53.9% |
Source: OnForex analysis of hourly prices from Yahoo Finance, January 2024 - October 2026 (gold: June 2024 - October 2026, COMEX gold futures); 4-hour bars are resampled from hourly.
The spread is wide: EURUSD was below a coin flip, while USDJPY was about 60%. Over this period USDJPY and gold rose strongly, so a long-only test favours them. With 73 to 107 cases per market, differences of a few points mean nothing. We read it as showing that the first touch of the 20 EMA is a place to look for evidence, not a rule that works by itself.
Common mistakes
- Buying every dip. Without the trend filter, you are catching falls.
- Using a tight stop at the average. The numbers above show how often tight stops are hit.
- Treating the 20 EMA as support. It is a moving line, not a level where orders sit.
- Averaging down. Adding to a losing pullback trade turns a planned loss into an unplanned one. See martingale.
- Ignoring the target. If the next obstacle is closer than 1R, there is no trade.
Next steps
Pick one pullback definition, write the rules down, and review 30 or more past cases, recording each in R. Then practise on a demo account. Related guides: price action, breakout strategy, stop-loss and drawdown.
Practise on a demo account first
Mark structure, FVGs and stops on a free Exness demo account before you risk money. Forex and CFD trading carries a high risk of loss.
Continue to ExnessForex and CFD trading involves significant risk. You may lose your invested capital.
Risk warning: Forex and CFD trading carries a high risk of loss and is not suitable for everyone. You can lose more than you deposit in some cases. Past patterns do not predict future results. This page is general education and not investment advice.
Related Articles
ADX Indicator: Settings, +DI/-DI and What Our Data Shows
ADX indicator guide: how ADX and +DI/-DI are calculated, what 20, 25 and 40 mean, how to use ADX to pick a method, and what our data shows on four markets.

Moving Averages in Forex: SMA, EMA, 200-Day Data
Moving averages in forex: SMA vs EMA formulas, 50/200 golden and death crosses, common periods, and what 9 years of daily data show about the 200-day line.
Forex Hedging Explained: Same-Account Hedges, Costs and Rules
How hedging works in forex: opposite positions in one account versus hedging with another pair, with a costed example of spread, swap and margin, and broker rules.

Dow Theory in Forex: The Six Tenets and How to Read Trends
Dow theory explained for forex: the six tenets in plain language, how to define a trend by highs and lows, and where it fits and fails on currency charts.

Fibonacci Retracement in Forex: Levels, Drawing, Data
Fibonacci retracement for forex: how to draw it, what 38.2%, 50% and 61.8% mean, and what 1,135 pullbacks show about whether price really respects the levels.
Inside Bar Strategy: How to Trade It, With Data on 1,773 Setups
What an inside bar is, how to read the mother bar, three ways to trade the break, and what 1,773 inside bars on EURUSD, GBPUSD, USDJPY and gold showed.