Inside Bar Strategy: How to Trade It, With Data on 1,773 Setups
What an inside bar is, how to read the mother bar, three ways to trade the break, and what 1,773 inside bars on EURUSD, GBPUSD, USDJPY and gold showed.
This site contains affiliate links. We may earn a commission if you sign up through our links. How we research
An inside bar is a candle whose high and low are both inside the range of the candle before it, which is called the mother bar. It marks a short pause in which price did not extend the previous range in either direction, and most inside bar strategies simply wait for the next candle to break above the mother bar's high or below its low. This guide shows how to read the pattern, three ways to trade the break, and what happened in 1,773 inside bars we measured on four markets.
Disclosure: OnForex may earn a referral commission from Exness links on this page. This is general education, not investment advice.
What an inside bar looks like
The pattern has two candles. The first is the mother bar, usually a larger candle that moved decisively. The second is the inside bar, which trades only within the mother bar's high-to-low range. The wicks matter, not just the bodies: if the inside candle's high pokes above the mother bar's high by even a small amount, it is not an inside bar by the strict definition.
Two variations are common:
- Multiple inside bars. Several consecutive candles stay inside the same mother bar. The range keeps shrinking, so the eventual break can be sharp, but it also means more waiting.
- Inside bar with a gap. On a daily chart a weekend gap can make the definition ambiguous, so many traders require a clean high-low containment and skip gap cases.
Why do traders care? A mother bar shows a burst of activity; the inside bar shows that neither buyers nor sellers could extend it. Compressed ranges often precede larger candles, and the mother bar gives you two objective levels (its high and low) for entries and stops. That clear structure is the main practical appeal. It is also a pattern that is easy to see after the fact, which is why testing it matters.
How we measured it
To avoid cherry-picked screenshots, we defined the pattern in code and counted every case. In the OnForex analysis of 4-hour candles built from hourly prices from Yahoo Finance, January 2024 - October 2026 (gold: June 2024 - October 2026, COMEX gold futures), an inside bar is a candle with its high and low inside the previous candle, and the mother bar must be at least 1 ATR(14) tall so that tiny candles are excluded. That gave 403 setups on EURUSD, 457 on GBPUSD, 480 on USDJPY and 433 on gold: 1,773 in total.
Two things we measured for each case:
- Which side broke first, the mother bar's high or its low.
- Follow-through: after the first break, did price travel one mother-bar range beyond the broken level before the opposite side of the mother bar was broken?
Reading the chart: a real example
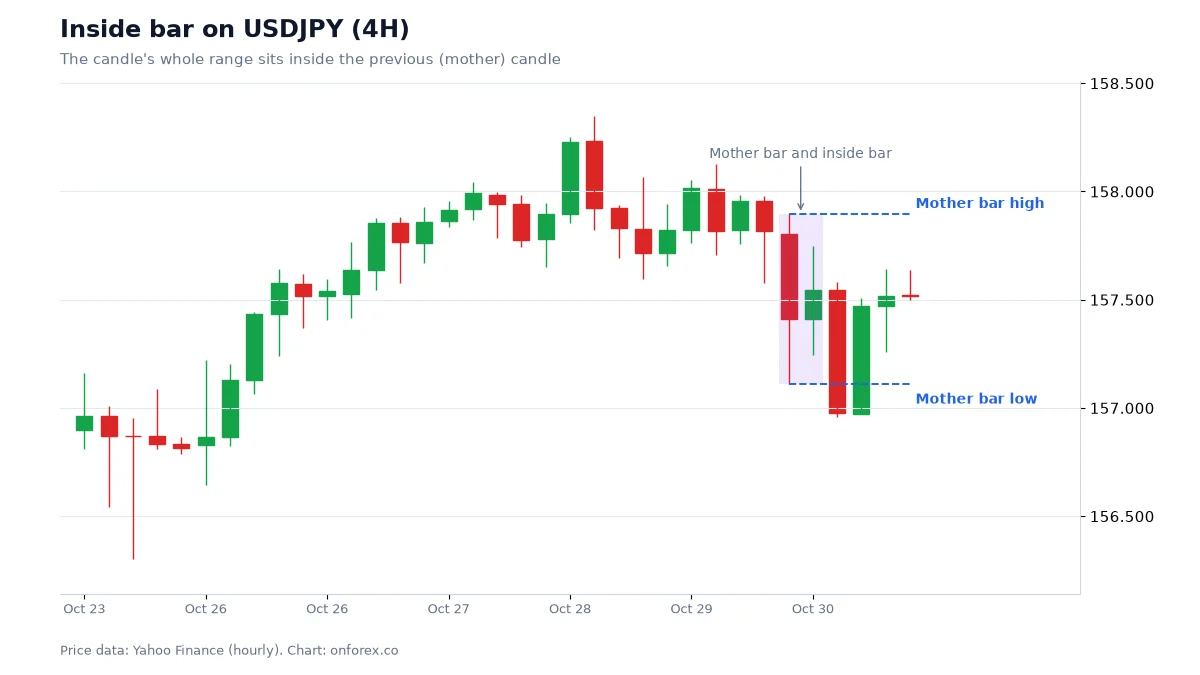
On the chart, the mother bar is the large candle, and the two horizontal lines mark its high and low. The next 4-hour candle (30 October 04:00 UTC) stayed between those lines, so it qualifies as an inside bar. Price then broke the mother bar's low. A trader who wanted to trade the break would have sold on the break of the low, placing a stop above the inside bar or mother bar depending on the plan.
This was one setup that happened to resolve cleanly. The next sections show how often that happens across all cases, and why one chart should never be the basis for a strategy.
Three ways to trade an inside bar
1. Break of the mother bar
The classic approach: place a pending order above the mother bar's high and another below its low, or watch the break and enter manually. The first side that breaks cancels the other plan. You must decide the stop in advance.
- Entry: a buy stop above the mother bar's high or a sell stop below its low. If price trades through before you are filled, you may get a worse price (slippage), especially around news.
- Stop: the opposite side of the mother bar (wide) or its midpoint (tighter). Add a buffer for spread; spreads often widen near candle opens and news.
- Target: a multiple of the stop distance (for example 1R or 2R) or one mother-bar range from the break.
2. Break with a close beyond the level
A more patient variant waits for a candle to close beyond the mother bar's high or low before entering. You give up some of the move and accept a wider stop, but you filter out false breaks where price pokes outside and returns, which is exactly the shape of a liquidity sweep.
3. Inside bar at a key level, with trend
Many traders only take inside bars that form at a meaningful location: a pullback into a prior support or resistance zone, at a discount or premium area in the dealing range, or in the direction of the higher-timeframe trend. The inside bar then acts as a timing tool rather than the whole reason for the trade. We did not test this discretionary context, so we cannot say it improves results; it is simply the way many practitioners use the pattern. Related reading: support and resistance, pullback trading and multi-timeframe analysis.
What our data showed
The results for the 4H inside bar:
| EURUSD | GBPUSD | USDJPY | XAUUSD | |
|---|---|---|---|---|
| Inside bars found | 403 | 457 | 480 | 433 |
| First break was upward | 49.4% | 51.8% | 57.4% | 52.8% |
| Price travelled one mother-bar range beyond the break before the opposite side broke | 53.4% | 48.8% | 56.1% | 59.2% |
Source: OnForex analysis of hourly prices from Yahoo Finance, January 2024 - October 2026 (gold: June 2024 - October 2026, COMEX gold futures), 4H candles resampled from hourly data.
What to take from it:
- The direction of the first break is close to a coin flip. Values from 49% to 57% are inside the range you would expect from noise with a few hundred cases. USDJPY and gold rose over the period, so their upward bias partly reflects the trend, not the pattern.
- Follow-through is only slightly better than even. After the first break, a little over half of cases reached one mother-bar range before the opposite side broke, and two markets were below 54%. On 1H data the same follow-through share was 53% to 55%.
- A positive result is not an edge by itself. Trading costs, stops placed inside the noise and the fact that a "1x target before the opposite side" test ignores the stop location all matter. Any real strategy must be tested with its own entry, stop and exit rules.
So the honest summary is: the pattern marks a pause and gives clean levels, but in our data it did not tell us which way price would go. If it helps you, the help comes from context and risk control, not from the candle shape alone.
A worked example with numbers
The levels below are illustrative, not from the chart above. Suppose on EURUSD 4H a mother bar has a high of 1.1200 and a low of 1.1140 (60 pips), and the next candle is an inside bar. You decide in advance that you will only sell a break of the low, because the higher-timeframe trend is down.
- Entry: sell stop at 1.1139 (1 pip under the low).
- Stop: above the mother bar's midpoint (1.1170) plus a 3-pip buffer for spread and noise = 1.1173. Stop distance is 34 pips.
- Target: one mother-bar range from the break = 1.1139 - 0.0060 = 1.1079. That is 60 pips, about 1.8R.
- Position size: on a USD 1,000 account risking 1% = USD 10. With a pip value of about USD 10 per standard lot on EURUSD, lots = 10 / (34 x 10) = about 0.03 lots.
Notice what the stop choice does: the midpoint stop is tighter than the far side of the mother bar, so it allows a larger position, but it is hit more often because the mother bar's midpoint is a level price easily revisits. If you use the far side of the mother bar instead, the stop is 60 pips plus buffer, and the same USD 10 risk gives only about 0.016 lots. The right choice depends on your plan and volatility; see stop loss placement and position sizing. Our random-entry stop test showed that a stop one ATR away is hit within 24 hours roughly 73% to 78% of the time, so a stop that is tighter than the normal noise will usually be touched even when the trade idea is fine.
Common mistakes
- Trading every inside bar. Small mother bars (a few pips) are dominated by spread. Require a minimum size, such as 1 ATR, as we did in the test.
- Entering before the break. Guessing the direction inside the bar is the same coin flip as above, with no confirmation.
- Ignoring false breaks. Price often pokes beyond the mother bar and returns. A close beyond the level, or a retest, filters some of these, but nothing removes them.
- Placing the stop right at the opposite side with no buffer. Spread and slippage can trigger it early. Brokers' spreads widen around news and rollover.
- Using it against a strong trend. A pause in a strong move often continues in the direction of the move. Read the market structure first.
- Judging the pattern from screenshots. A handful of clean examples is survivorship bias. Backtest your exact rules; our backtesting guide explains how to avoid fooling yourself.
Inside bar vs other candlestick patterns
An inside bar is a two-candle range pattern, while engulfing and pin bar patterns describe a reversal-style close. If you are comparing, read the engulfing pattern guide, the pin bar guide and the wider candlestick patterns overview. For breakout-style entries in general, see the breakout strategy guide. Whatever pattern you choose, risk management decides how long you stay in the game, and price action puts the candle in context.
Practice checklist
- Mark mother bars of at least 1 ATR on a demo chart for two weeks and log every inside bar.
- Record which side broke first and whether a close beyond the level followed.
- Write down the stop, target and lot size before the break, then compare plan against result.
- Review the log: how often did your context filter (trend, level) add anything compared with taking all of them?
Practise on a demo account first
Mark structure, FVGs and stops on a free Exness demo account before you risk money. Forex and CFD trading carries a high risk of loss.
Continue to ExnessForex and CFD trading involves significant risk. You may lose your invested capital.
Risk warning: Forex and CFD trading carries a high risk of loss and is not suitable for everyone. Past price behaviour does not predict future results, and stops can fill at worse prices during fast markets or gaps. Never risk money you cannot afford to lose.
Related Articles
London Breakout Strategy: Asian Range Rules, Times and Data
London breakout strategy explained: how to mark the Asian range, entry, stop and target variants, false breakouts, UTC and JST times, and our data on four markets.
Pin Bar: How to Spot, Trade and Test a Pin Bar Candle
Pin bar explained: bullish and bearish pin bar rules, where they matter, a worked trade with stop and sizing, plus how pin bars performed in our 4-market data.
Engulfing Pattern: How to Read and Test Engulfing Candles
Engulfing pattern explained: bullish and bearish engulfing rules, context, a worked example with stop and sizing, and how it performed in our 4-market data.
Breakout Trading Strategy: How to Trade Forex Breakouts
Master forex breakout trading in 2026. Learn how to identify real breakouts, filter false breaks with volume, and apply precise entry and exit rules to capture big moves.

ICT Silver Bullet: Times, Rules and What Our Data Shows
The ICT silver bullet strategy: the 10-11 am New York window, the sweep-and-FVG entry, time zone conversions, and our data on what that hour does.
Bollinger Bands: Settings, Squeeze and What the Data Shows
Bollinger Bands explained: the 20/2 formula, %B and bandwidth, the squeeze, walking the bands and a W-bottom, with hit rates from our own hourly forex data.