Pin Bar: How to Spot, Trade and Test a Pin Bar Candle
Pin bar explained: bullish and bearish pin bar rules, where they matter, a worked trade with stop and sizing, plus how pin bars performed in our 4-market data.
This site contains affiliate links. We may earn a commission if you sign up through our links. How we research
A pin bar is a single candle with a long wick and a small body, where the long wick points into a price that the market tried to reach and was pushed away from. A bullish pin bar has a long lower wick, usually at a low; a bearish pin bar has a long upper wick, usually at a high. In our 4-hour data on four markets the bare pin bar landed close to coin-flip results with very few cases, so treat it as a location worth studying, not as a signal.
Disclosure: OnForex may earn a referral commission from Exness links on this page. This is general education, not investment advice.
This guide explains what makes a good pin bar, how to read the wick, where traders look for them, a worked example (including one that failed), what our own statistics say, and how to test the idea yourself.
What is a pin bar?
The name comes from the shape: a long thin "nose" (the wick) sticking out of a small body, like a pin. Each candle records four prices: open, high, low and close. The wick (shadow) is the line beyond the body, and it records how far price travelled and then returned within that period.
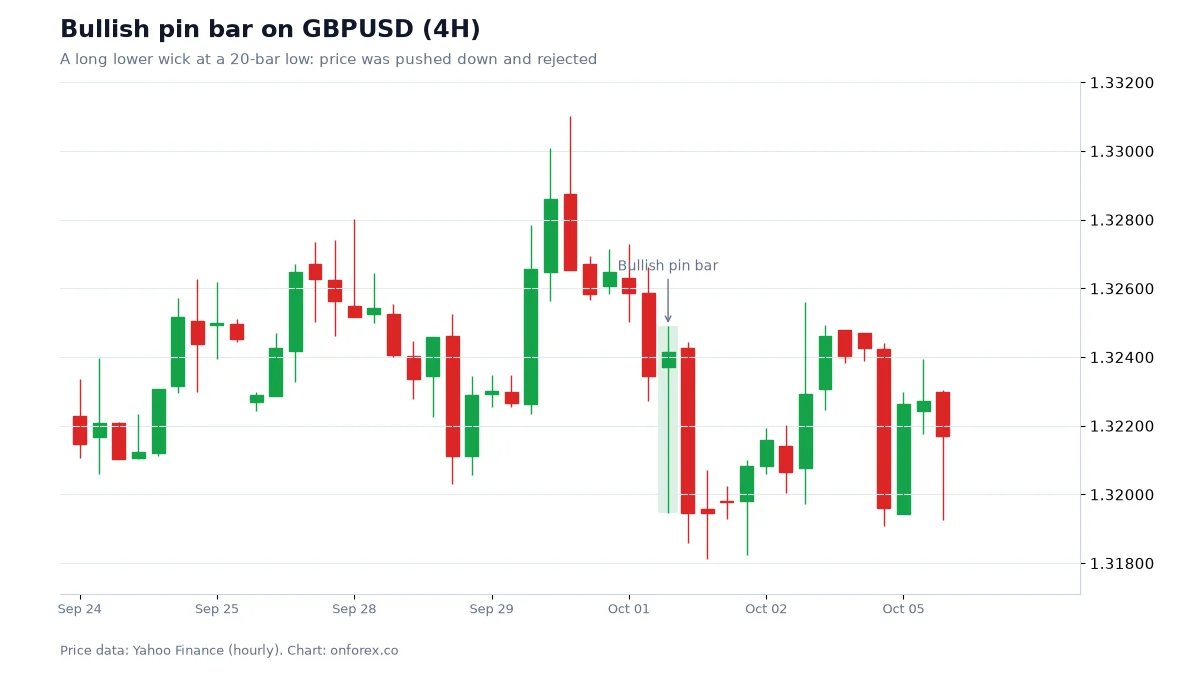
A bullish pin bar says: sellers pushed price down, then buyers took it back up before the candle closed. A bearish pin bar says the opposite at a high. The rejection of a price is the whole message.
Rules we use in testing
There is no official definition. These are the rules in our test and a good starting point for yours:
| Part | Rule |
|---|---|
| Size | Candle range at least 0.5 ATR(14), so tiny candles are ignored |
| Wick | Long wick at least two thirds of the candle's range |
| Location | Bullish: the low is the lowest of the last 20 candles. Bearish: the high is the highest of the last 20 |
| Close | Near the opposite end from the wick (follows from the wick rule) |
Note that the colour of the body does not matter much: a pin bar with a small red body and a long lower wick still shows rejection of the low.
Pin bar, hammer and shooting star
Traditional Japanese candlestick names are close cousins. A hammer is a small body with a long lower wick after a decline; a shooting star is the mirror at a high. Pin bar is the price action term that puts the weight on the wick and where it sits. If you want a list of named patterns, see candlestick patterns.
What the wick is telling you
The usual reading is that the wick marks a price at which the market refused to stay. If a lot of stop orders sit under an old low, price may spike through them, trigger them, and then reverse as soon as that selling is exhausted. That is the logic of a liquidity sweep: a wick beyond a swing point that closes back inside the range. Many of the best-looking pin bars on charts are sweeps.
This reading is a story about order flow that we cannot see directly. What we can see is price. So the practical question is not "does this pin bar prove a reversal?" but "is this a place where I would want to buy anyway, and where would my idea be wrong?"
Where pin bars matter
A pin bar floating in the middle of a range is noise. Traders usually require at least one of these:
- A level. A prior swing low or high, a daily high or low, or a round number (support and resistance).
- A sweep. A wick that goes beyond an obvious swing and closes back inside.
- A zone from a bigger picture. An order block, or the discount side of a larger range (premium and discount).
- A trend that agrees. A bullish pin bar in a higher-time-frame uptrend is a pullback idea (pullback trading); against the trend it is a riskier counter-trend idea.
How traders trade a pin bar
This is a skeleton plan to test, not advice.
- Wait for the close. A long wick can still be reversed by a final spike before the candle closes.
- Entry options: at the close of the pin bar; a buy stop a few pips above its high (confirmation that price moves away from the wick); or a limit order near 50% of the wick (smaller stop, but it may not fill).
- Stop: beyond the tip of the wick plus a buffer for spread and slippage (a stop is executed as a market order and can fill worse in a fast move).
- Target: decide in R, your risk unit, before entering (risk-reward ratio).
- Size from the stop (position sizing).
A worked example, including a loss
The numbers are read approximately from the GBPUSD chart above and are illustrative.
- Pin bar close (entry): about 1.3241.
- Tip of the lower wick: about 1.3195.
- Stop: 5 pips below the wick, at about 1.3190. Distance: about 51 pips.
- Account: USD 3,000. Risk per trade: 1% = USD 30.
- Pip value for one standard lot on GBPUSD: roughly USD 10 per pip.
- Position size: 30 / (51 x USD 10) = 0.059 lots, rounded down to 0.05 lots.
- Target at 2R: 102 pips above, about 1.3343.
What happened next on that chart: the following 4-hour candle was a large red one that closed near the low of the pin bar, and a later candle's wick reached about 1.3186, below the stop. So this trade would have lost 1R, or about USD 30 (a little more if the stop slipped).
This is the point of showing it. A pin bar is a good-looking candle on a chart, but after it appears it only tells you where to put the stop. A trader who risks 1% per trade can take this loss many times, which is why risk per trade is more important than the pattern.
Our data: how did pin bars perform?
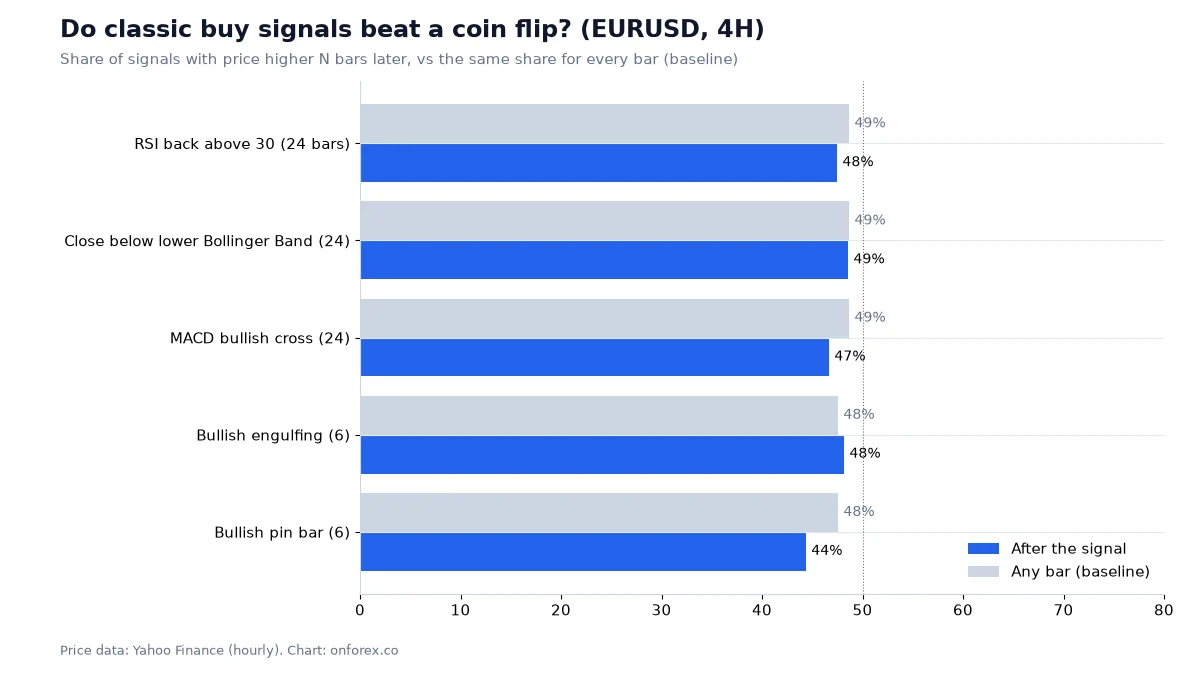
We tested pin bars with hourly prices from Yahoo Finance, January 2024 to October 2026 (gold: June 2024 to October 2026, COMEX gold futures), building 4-hour candles from the hourly data. This is the OnForex analysis of those prices. The outcome is the direction of price 6 candles (24 hours) after the pin bar. The baseline is the share of all candles after which price was higher (or lower) over the same period. USDJPY and gold rose over the period, so their "higher" baselines are above 50%.
| 4-hour, 24 hours later | EURUSD | GBPUSD | USDJPY | XAUUSD |
|---|---|---|---|---|
| Bullish pin bar: price higher (cases) | 44.4% (45) | 50.0% (40) | 70.0% (40) | 51.5% (33) |
| Baseline: price higher | 47.6% | 51.4% | 55.9% | 54.0% |
| Bearish pin bar: price lower (cases) | 64.0% (51) | 47.8% (46) | 63.6% (22) | 44.4% (27) |
| Baseline: price lower | 52.4% | 48.6% | 44.1% | 46.0% |
On 1-hour candles there were more cases and no clear edge. Bullish pin bars were followed by a higher price 58.4% (161 cases), 50.6% (166), 49.7% (179) and 49.3% (136) of the time.
How to read it
- Sample sizes are small. With 22 to 51 cases per cell, the uncertainty in any percentage is large: roughly plus or minus 14 to 20 points at 95% confidence. A 70% result on 40 cases (USDJPY bullish) is entirely consistent with luck.
- USDJPY rose in this period, so bullish results there start from a high baseline (55.9%).
- The result is not consistent. EURUSD bearish pin bars looked good (64%), while EURUSD bullish pin bars looked worse than the baseline (44%). A real effect would not usually flip like that.
- We did not test context such as pin bars at a sweep of a prior high or low on a higher-time-frame trend. That is how many traders use the pattern, and we cannot say if it works.
Conclusion: the bare pin bar is a way to describe rejection, not a signal. Combine it with a plan that you have tested yourself (backtesting).
Common mistakes
- Trading every long wick. Without a level, a long wick is just a candle that moved and returned.
- Ignoring the stop distance. A long wick means a wide stop. If your size at 1% risk becomes too small to trade, skip the setup rather than shrinking the stop.
- Stop exactly at the tip. Price often touches the wick's tip again before moving. Use a buffer based on ATR (ATR indicator).
- Counting the winners only. The winning pin bars are easy to find on a chart and the losing ones are quietly forgotten. Record all of them.
- Using it as a prediction. A pin bar changes where you place a trade; it does not change the 50/50 nature of the next candle much.
- Looking only at the pin bar. Check the bigger market structure first.
Pin bar and its neighbours
| Pattern | Idea | Page |
|---|---|---|
| Pin bar | One candle shows rejection | This page |
| Engulfing | A body covers the previous body | Engulfing pattern |
| Inside bar | Range contracts inside the previous candle | Inside bar |
| Price action | Reading price without indicators | Price action |
How to practise
Pick one time frame and one market. Mark every pin bar that meets your written rule across at least 50 past examples. For each, note the entry, the stop and whether 1R, 2R or the stop came first. Then add one context rule at a time (for example "only at a sweep of the previous day's low") and see whether the results actually change. Only after that, go forward on a demo account. Remember that spreads widen around news releases and at the daily open, which affects tight stops the most.
Practise on a demo account first
Mark structure, FVGs and stops on a free Exness demo account before you risk money. Forex and CFD trading carries a high risk of loss.
Continue to ExnessForex and CFD trading involves significant risk. You may lose your invested capital.
Risk warning: Forex and CFD trading carries a high risk of loss and is not suitable for everyone. You can lose more than your deposit in some cases. Past price behaviour, including the results in this article, does not predict future results. This page is general education and not investment advice.
Related Articles
Engulfing Pattern: How to Read and Test Engulfing Candles
Engulfing pattern explained: bullish and bearish engulfing rules, context, a worked example with stop and sizing, and how it performed in our 4-market data.
Divergence in Forex: Regular and Hidden RSI/MACD Guide
Divergence explained: regular and hidden RSI and MACD divergence, how to spot it, why it fails, and what 965 cases in our own price data showed.
Inside Bar Strategy: How to Trade It, With Data on 1,773 Setups
What an inside bar is, how to read the mother bar, three ways to trade the break, and what 1,773 inside bars on EURUSD, GBPUSD, USDJPY and gold showed.
Order Block: How to Mark It, Trade It and Test It
Order block explained: bullish and bearish OB, how to mark one step by step, mitigation, valid vs weak blocks, and how often OBs held in our own price data.
Breaker Block: What It Is and How It Differs From an OB
Breaker block explained: how a failed order block becomes a breaker, breaker vs mitigation block vs order block, how to mark one, and the risks of trading it.
ADX Indicator: Settings, +DI/-DI and What Our Data Shows
ADX indicator guide: how ADX and +DI/-DI are calculated, what 20, 25 and 40 mean, how to use ADX to pick a method, and what our data shows on four markets.