Divergence in Forex: Regular and Hidden RSI/MACD Guide
Divergence explained: regular and hidden RSI and MACD divergence, how to spot it, why it fails, and what 965 cases in our own price data showed.

This site contains affiliate links. We may earn a commission if you sign up through our links. How we research
Divergence is a disagreement between price and a momentum oscillator such as RSI or MACD: price makes a new extreme, but the indicator does not. It suggests the push behind the move is getting weaker. It does not say that price must reverse, and in our own data it pointed the right way only about half the time.
Disclosure: OnForex may earn a referral commission from Exness links on this page. This is general education, not investment advice.
This guide explains regular and hidden divergence, shows how to find it on a chart step by step, covers the usual reasons it fails, and gives the results of our own test of RSI divergence on four markets.
What is divergence?
An oscillator is an indicator that moves in a range and measures how strong recent price moves have been. RSI (Relative Strength Index) is the most common one, usually set to 14 periods and scaled from 0 to 100. MACD (Moving Average Convergence Divergence) is the gap between two moving averages of price, drawn as a line and a histogram. If you need the basics first, read our guides to RSI and MACD.
Both indicators are calculated from past closing prices. In a clean trend they rise and fall with price. Divergence is the moment when they stop doing so: price pushes to a new high or low, but the indicator's own high or low is smaller than last time. The usual reading is that each new push is being made with less force.
Two points stop most beginner mistakes:
- Divergence compares swings, not single candles. You need two clear swing highs (or lows) in price and the matching two peaks (or troughs) on the indicator.
- Divergence is a description of momentum. It is not a prediction. A tired trend can stay tired for a long time while price keeps moving.
Regular divergence
Regular divergence compares two swing extremes in the same direction and hints at a possible reversal.
| Bullish regular divergence | Bearish regular divergence | |
|---|---|---|
| Price | Lower low | Higher high |
| RSI or MACD | Higher low | Lower high |
| Where it appears | End of a down move | End of an up move |
| What it hints at | Selling pressure is fading | Buying pressure is fading |
The chart below shows a bearish example on gold.
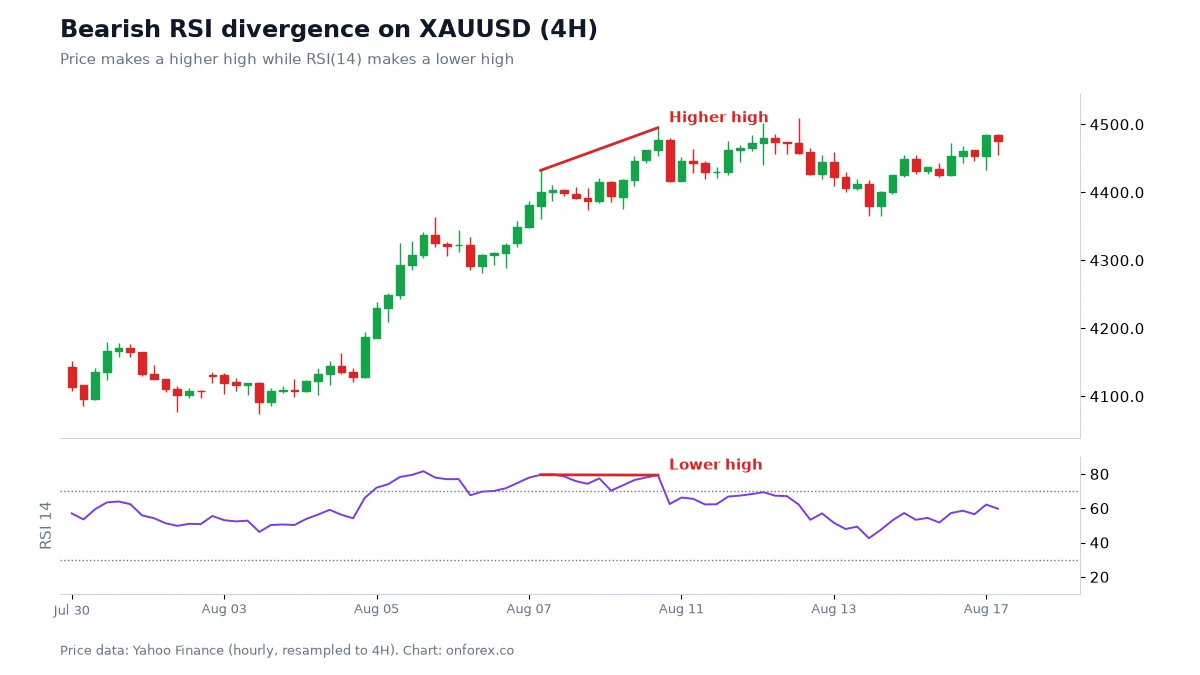
On the chart, price tags a second high above the first. The RSI line at the second high sits below the RSI line at the first. That mismatch is the whole pattern. What price did afterwards is the part you cannot know in advance.
Hidden divergence
Hidden divergence compares two pullbacks inside a trend and hints at a possible continuation. It is called hidden because it looks like the opposite of the regular kind.
| Bullish hidden divergence | Bearish hidden divergence | |
|---|---|---|
| Price | Higher low | Lower high |
| RSI or MACD | Lower low | Higher high |
| Where it appears | Pullback in an uptrend | Rally in a downtrend |
| What it hints at | The uptrend may resume | The downtrend may resume |
The logic is that the oscillator dropped further than price did during the pullback, yet price still held a higher low. Some traders read that as a sign that the trend is stronger than the oscillator suggests. It is one more way of describing a pullback, so it pairs naturally with our guide to pullback trading.
A caution: hidden divergence is even easier to find after the fact than regular divergence, because almost every pullback in a trend can be made to fit if you choose the swing points freely. We did not test hidden divergence in our data, so we make no claim about how often it works.
How to spot divergence step by step
- Pick one timeframe and the indicator's default settings. RSI(14) or the standard MACD (12, 26, 9). Changing settings until a divergence appears is the most common way to fool yourself.
- Mark swing highs or lows in price first. A swing high is a high with lower highs on both sides. Do this before you look at the indicator. See market structure for how to mark swings.
- Draw a line between the two price extremes, then a line between the two matching indicator extremes. If one slopes up and the other slopes down, you have regular divergence.
- Check the context. Is price at a level that matters, such as support or resistance? A divergence in the middle of nowhere has less to say.
- Wait for structure to change. A closing break of the last swing against the move (an MSS in SMC terms) is a stronger sign than the divergence line alone.
- Define the stop before the entry. Put it beyond the latest extreme plus a buffer for spread and slippage. Size the position from it (see position sizing).
Steps 5 and 6 are what separate noting a divergence from trading one.
A worked example (illustrative numbers)
These numbers are made up to show the arithmetic. They are not from the chart above.
Suppose EURUSD rallies to a high of 1.1100, pulls back, then makes a second high at 1.1130 while RSI(14) peaks at 68 and then 61. That is bearish divergence. A trader waits for a close below the pullback low at 1.1075, which confirms a structure break, and enters short at 1.1072. The stop goes above the second high at 1.1130 plus a 3-pip buffer, at 1.1133. The risk is 61 pips.
On a USD 1,000 account risking 1% (USD 10), the position size is 10 / (61 x 10) = about 0.016 lots, which in practice means a micro lot of 0.01 if the broker allows only that step. If the trader wants a 2R target, it sits 122 pips below entry at 1.0950. That is a long distance for a 4-hour setup, which is exactly why you should check what the stop and target imply before you take any divergence trade. See risk-reward ratio for the break-even maths.
Why divergence fails
Strong trends repeat divergence. In a persistent trend, RSI can show lower highs while price still climbs for many more candles. Traders who sold the first divergence are stopped out, then the second, then the third.
An oscillator is derived from price. RSI and MACD contain no information that price does not already have. They rearrange it. So divergence often confirms what you can already see in the swing sizes.
RSI is bounded. It cannot go above 100, and in a strong move it spends long periods above 70. A lower RSI high at 75 versus 82 can be a small difference in a place where the indicator is saturated.
Swing selection is subjective. Allow any gap between the two swings and almost any chart will show a divergence somewhere. That is why rules written before you look at the chart matter.
Spreads and slippage hit tight entries. Spreads widen around news and the daily open, and stop orders can fill beyond the price you set. A tight divergence stop is more exposed to this.
Our data: how often did RSI divergence point the right way?
We tested RSI(14) divergence on hourly and 4-hour prices. A divergence counted when two swings were 5 to 40 bars apart. For bearish cases the first RSI peak had to be above 60, and for bullish cases the first RSI trough below 40. We then looked at whether price had moved in the direction of the divergence 24 bars later.
| Market | 1H: price moved the divergence way (cases) | 4H: price moved the divergence way (cases) |
|---|---|---|
| EURUSD | 45.4% (174) | 52.9% (51) |
| GBPUSD | 49.3% (209) | 49.0% (51) |
| USDJPY | 56.6% (212) | 36.5% (52) |
| XAUUSD | 54.3% (175) | 58.5% (41) |
Source: OnForex analysis of hourly prices from Yahoo Finance, January 2024 - October 2026 (gold: June 2024 - October 2026, COMEX gold futures); 4-hour bars are resampled from hourly. Swing = highest or lowest of 3 bars each side.
The results range from 36.5% to 58.5% and have no consistent pattern across markets or timeframes. The 4-hour samples, with 41 to 52 cases each, are too small to read anything into. The honest summary is that divergence behaved roughly like a coin flip on these markets. Gold and USDJPY drifted in particular directions over the period, which affects any test that only measures direction 24 bars later. Treat divergence as one input, not a signal.
Common mistakes
- Trading every divergence. In our data roughly half did not play out. Without a structure break and a defined stop, there is no plan.
- Counting divergence on tiny swings. Two candles one bar apart are noise.
- Adding more indicators to confirm. RSI, MACD and stochastics are the same information three ways.
- Ignoring the higher timeframe. A bearish divergence against a strong daily uptrend is a weak setup.
- Moving the stop to avoid a loss. The divergence is invalidated if price makes a new extreme beyond your stop.
Next steps
Mark divergences on past charts using fixed rules, record each result in R, and review 30 to 50 cases before you decide whether it adds anything. Then practise on a demo account. Related guides: price action, double tops and bottoms and stop-loss.
Practise on a demo account first
Mark structure, FVGs and stops on a free Exness demo account before you risk money. Forex and CFD trading carries a high risk of loss.
Continue to ExnessForex and CFD trading involves significant risk. You may lose your invested capital.
Risk warning: Forex and CFD trading carries a high risk of loss and is not suitable for everyone. You can lose more than you deposit in some cases. Past patterns do not predict future results. This page is general education and not investment advice.
Related Articles
MACD Indicator: How to Use MACD in Forex (Formula + Example)
MACD indicator in forex explained: the 12/26/9 formula, signal line and histogram, a worked numeric example, divergence, structure filters and limits.
RSI Indicator: Settings, Strategies and What Our Data Shows
RSI indicator guide: Wilder's formula, the 14 setting, overbought and oversold levels and divergence, with tests on four markets of what RSI can do.

Breaker Block: What It Is and How It Differs From an OB
Breaker block explained: how a failed order block becomes a breaker, breaker vs mitigation block vs order block, how to mark one, and the risks of trading it.

Pin Bar: How to Spot, Trade and Test a Pin Bar Candle
Pin bar explained: bullish and bearish pin bar rules, where they matter, a worked trade with stop and sizing, plus how pin bars performed in our 4-market data.

Engulfing Pattern: How to Read and Test Engulfing Candles
Engulfing pattern explained: bullish and bearish engulfing rules, context, a worked example with stop and sizing, and how it performed in our 4-market data.

Order Block: How to Mark It, Trade It and Test It
Order block explained: bullish and bearish OB, how to mark one step by step, mitigation, valid vs weak blocks, and how often OBs held in our own price data.