Double Top and Double Bottom: Neckline, Target, Retest
Double top and double bottom explained: neckline, measured move target, retest entries, head and shoulders, and our 4-hour data on 37 clean cases.

This site contains affiliate links. We may earn a commission if you sign up through our links. How we research
A double top is a reversal pattern in which price reaches almost the same high twice and then closes below the low that sat between them, called the neckline. A double bottom is the mirror image after a fall. The pattern only counts once that closing break happens, and even then it is a location to plan around, not a signal that guarantees a turn.
Disclosure: OnForex may earn a referral commission from Exness links on this page. This is general education, not investment advice.
This guide shows how to draw the neckline, how to calculate the measured move target, the three common ways to enter, and a short section on head and shoulders and triple tops. It ends with our own count of how often a strict double top appeared and how it ended.
What is a double top?
A double top forms in four stages:
- Price rises in an uptrend and makes a first high.
- Price pulls back to a swing low. A horizontal line through that low is the neckline.
- Price rallies again and stops at about the same level as the first high, making the second high.
- Price falls and closes below the neckline. This confirms the pattern.
The story behind it is simple. Buyers pushed to a level twice and failed both times, so some traders expect sellers to take control once the support under the pattern breaks. That is a story about psychology, and it is only a useful explanation if price actually behaves that way. Price often does not.
Double bottom: the mirror image
| Double top | Double bottom | |
|---|---|---|
| Comes after | An up-move | A down-move |
| Structure | Two similar highs | Two similar lows |
| Neckline | Swing low between the highs | Swing high between the lows |
| Confirmation | Close below the neckline | Close above the neckline |
| Measured move | Down, by the pattern height | Up, by the pattern height |
Everything below applies to both. For a double bottom, flip "high" and "low" and "below" and "above".
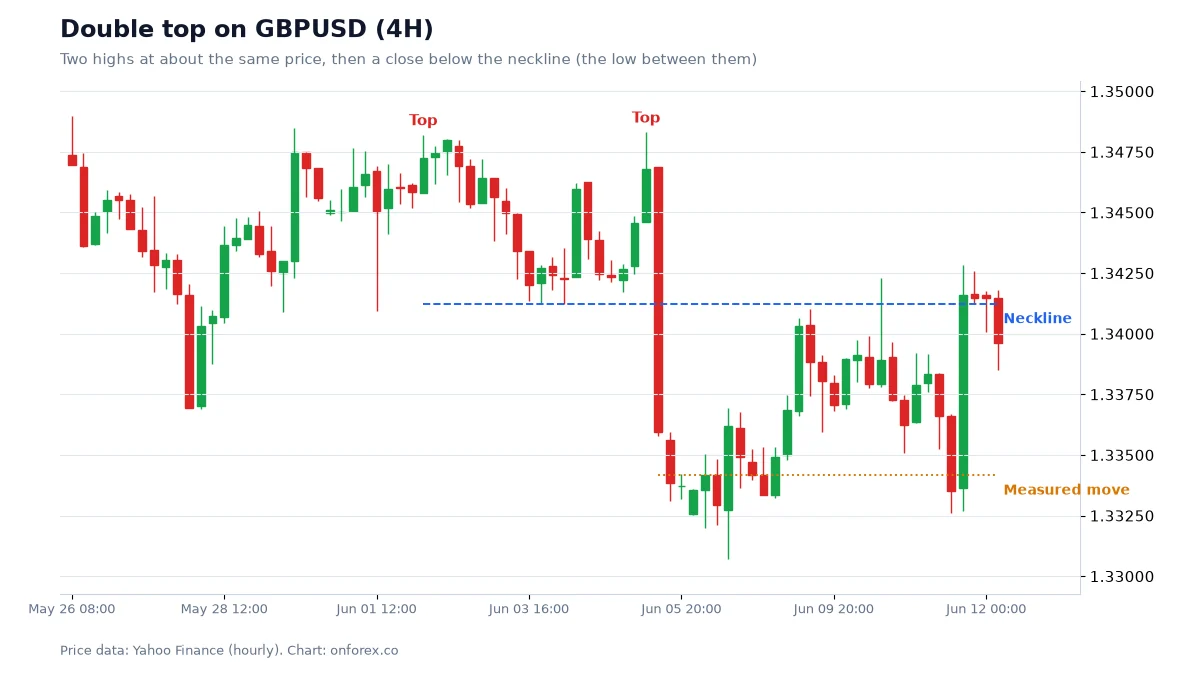
On the chart, notice three things: the two highs are close but not identical, the break of the neckline needs a candle close and not just a wick, and the measured move is projected from the neckline, not from the highs.
How to draw the neckline and measure the target
Neckline. Draw a horizontal line through the lowest point between the two highs. A sloping neckline is sometimes used, but a flat one is easier to define and to test.
Pattern height. Subtract the neckline from the average of the two highs.
Measured move. Project the pattern height below the neckline. The result is a possible target.
An illustrative example with made-up numbers: GBPUSD makes highs at 1.2800 and 1.2796, with the neckline at 1.2700. The average high is 1.2798, so the pattern height is 98 pips. The measured move target is 1.2700 minus 98 pips, which is 1.2602.
The measured move is a rule of thumb. It is useful because it gives you a target you can compare with your stop before you enter. Whether price reaches it is a separate question.
Three ways to enter
| Entry | How it works | Strength | Weakness |
|---|---|---|---|
| Break entry | Sell on the close below the neckline | Early, you rarely miss the move | Wide stop above the highs; false breaks |
| Retest entry | Wait for price to come back to the neckline and fail | Closer stop, better reward-to-risk | The retest may never happen |
| Early entry | Sell at the second high before the break | Smallest stop | The pattern is not confirmed; it is only a guess |
For a retest entry, the neckline works as resistance after being support. This is the same flip you see in support and resistance.
A worked example for the retest entry (illustrative numbers)
Using the example above: the retest brings price back to 1.2700 and a bearish candle rejects it. The trader sells at 1.2698 and puts the stop above the second high at 1.2800 plus a 3-pip buffer. That is a stop at 1.2803, which is 105 pips of risk. The target at 1.2602 is 96 pips away. The reward is less than 1R, which means this setup has a poor ratio. A trader could place the stop just above the retest candle instead, say at 1.2735 (37 pips), which makes the target about 2.6R. But a stop that close will be hit more often. The point of doing the arithmetic is that the pattern does not decide the stop for you.
On a USD 1,000 account risking 1% (USD 10), a 37-pip stop gives 10 / (37 x 10) = 0.027 lots, so practically 0.02 lots with the lot step rounded down. See position sizing and risk-reward ratio.
Head and shoulders and triple tops
These are close relatives. We describe them in words only.
- Head and shoulders has three highs. The middle one (the head) is the highest, and the two outer ones (the shoulders) are lower and roughly equal. The neckline joins the lows between them. A close below it confirms the pattern. The measured move is the distance from the head to the neckline, projected below the neckline. The inverse head and shoulders is the mirror image at a bottom.
- Triple top has three similar highs instead of two, with a neckline below. It is the same logic as a double top with one more failed attempt. A triple bottom is its mirror.
The more swings a pattern needs, the rarer it is and the more freedom you have in choosing which swings count. That freedom is where hindsight bias enters.
Why these patterns fail
- Many double tops are just pauses. Price makes two similar highs, then breaks above them and continues. Without the neckline close, there is no pattern.
- Breaks can be false. Price closes below the neckline, then reclaims it within a few candles. A stop above the highs absorbs this. A tight stop does not.
- The stop is often far away. The pattern height can be 80 to 100 pips on a 4-hour chart, so the reward is not always better than the risk.
- Spreads and slippage. Spreads widen around news and the open, and stop orders can fill beyond your price.
- The trend can win. Selling a double top against a strong higher-timeframe uptrend is a harder trade. Check trend direction first.
Our data: how often did a strict double top appear?
We searched 4-hour prices for double tops with strict rules: two highs within 0.25 ATR of each other, 8 to 60 bars apart, at least 2 ATR above the neckline, and a close below the neckline to confirm. ATR is the average true range, a measure of typical bar size. We then checked whether the measured move was reached before price made a new high above the pattern.
| Market | Confirmed double tops | Measured move reached before a new high |
|---|---|---|
| EURUSD | 7 | 85.7% |
| GBPUSD | 12 | 50.0% |
| USDJPY | 10 | 60.0% |
| XAUUSD | 8 | 62.5% |
Source: OnForex analysis of hourly prices from Yahoo Finance, January 2024 - October 2026 (gold: June 2024 - October 2026, COMEX gold futures); 4-hour bars are resampled from hourly.
There were 37 cases in total across almost three years and four markets. That is rare under strict rules, and 7 to 12 cases per market is far too few to draw a conclusion from: 85.7% of 7 is 6 cases. We do not claim that double tops work or do not work. What the numbers do show is that a clean, strict double top is uncommon, so a chart full of "double tops" has usually been drawn with looser rules than ours.
Common mistakes
- Entering before the neckline closes. Without confirmation you have two highs, nothing more.
- Drawing the highs too loosely. If the two highs differ by 40 pips, they are two different highs.
- Using the measured move as a promise. It is a reference for planning.
- Using a stop that ignores the pattern. Place it where the pattern is invalidated, then size the position to fit.
- Forgetting the higher timeframe. A pattern against a strong trend needs more evidence.
Next steps
Find past double tops and bottoms under fixed rules, record the outcome in R, and compare 30 or more cases before you trust the pattern. Then practise on a demo account. Related guides: divergence, price action, candlestick patterns and stop-loss.
Practise on a demo account first
Mark structure, FVGs and stops on a free Exness demo account before you risk money. Forex and CFD trading carries a high risk of loss.
Continue to ExnessForex and CFD trading involves significant risk. You may lose your invested capital.
Risk warning: Forex and CFD trading carries a high risk of loss and is not suitable for everyone. You can lose more than you deposit in some cases. Past patterns do not predict future results. This page is general education and not investment advice.
Related Articles

Head and Shoulders Pattern: Neckline, Target and Real Data
Head and shoulders pattern and inverse head and shoulders: neckline, measured move, stop above the right shoulder, and our data on 141 strict cases.
Engulfing Pattern: How to Read and Test Engulfing Candles
Engulfing pattern explained: bullish and bearish engulfing rules, context, a worked example with stop and sizing, and how it performed in our 4-market data.
Forex Swap Explained: Swap Rates, Formula and Triple Swap
What is a forex swap? How swap fees are calculated with a worked formula, when triple swap applies, long vs short rates, swap in MT4/MT5 and swap-free accounts.
Inside Bar Strategy: How to Trade It, With Data on 1,773 Setups
What an inside bar is, how to read the mother bar, three ways to trade the break, and what 1,773 inside bars on EURUSD, GBPUSD, USDJPY and gold showed.
Multiple Time Frame Analysis: Top-Down Analysis in Forex
Multiple time frame analysis explained: how top-down analysis works, which timeframes to combine, a step-by-step routine, and what our trend data showed.

Forex vs Cryptocurrency: Key Differences & Which to Trade
Forex vs crypto compared on volatility, regulation, liquidity, trading hours and risk, to help you understand which market suits your goals and limits.