Head and Shoulders Pattern: Neckline, Target and Real Data
Head and shoulders pattern and inverse head and shoulders: neckline, measured move, stop above the right shoulder, and our data on 141 strict cases.

This site contains affiliate links. We may earn a commission if you sign up through our links. How we research
The head and shoulders pattern is a reversal chart pattern made of three swing highs: a left shoulder, a higher head, and a right shoulder at roughly the same height as the left. The pattern is confirmed only when price closes below the neckline, the line joining the two lows between the highs. The inverse head and shoulders is the same shape upside down at a market bottom.
Disclosure: OnForex may earn a referral commission from Exness links on this page. This is general education, not investment advice.
This guide covers how to draw the pattern and its neckline, how the measured move target works, where the invalidation sits, a worked example with position sizing, and our own count of strict head and shoulders patterns on four markets. The count is less flattering than most textbook descriptions, and we show a chart where the pattern failed.
The anatomy of a head and shoulders
A head and shoulders top builds in five steps:
- Left shoulder. In an uptrend, price makes a swing high and pulls back to a low.
- Head. Price rallies to a higher high than the left shoulder, then falls back to a second low near the first.
- Right shoulder. Price rallies again but stops below the head, roughly at the height of the left shoulder.
- Neckline. A line through the two lows (the troughs after the left shoulder and after the head). It can be flat or slightly sloped.
- Confirmation. A candle closes below the neckline. A wick through it does not count.
The usual story: buyers made a new high at the head but could not repeat it at the right shoulder. The failure to make another higher high is the first warning; the neckline break is the evidence that buyers have lost the lows they were defending.
The same shape in market-structure terms
If you use market structure or smart money concepts, you can describe the same pattern with standard terms:
- The head trades above the left shoulder, taking the buy-side liquidity (BSL, the cluster of buy stops) resting above that high. That is close to a liquidity sweep, although the head usually closes above the shoulder for a while rather than snapping back at once.
- The right shoulder is a lower high (LH), the first sign the up-move is losing structure.
- The close below the neckline breaks the last higher low (HL). That is a market structure shift (MSS), the first break against the prior trend.
Seen this way, a head and shoulders is simply one specific way a trend can end: a final push, a lower high, and a broken low. It is not a separate force acting on price.
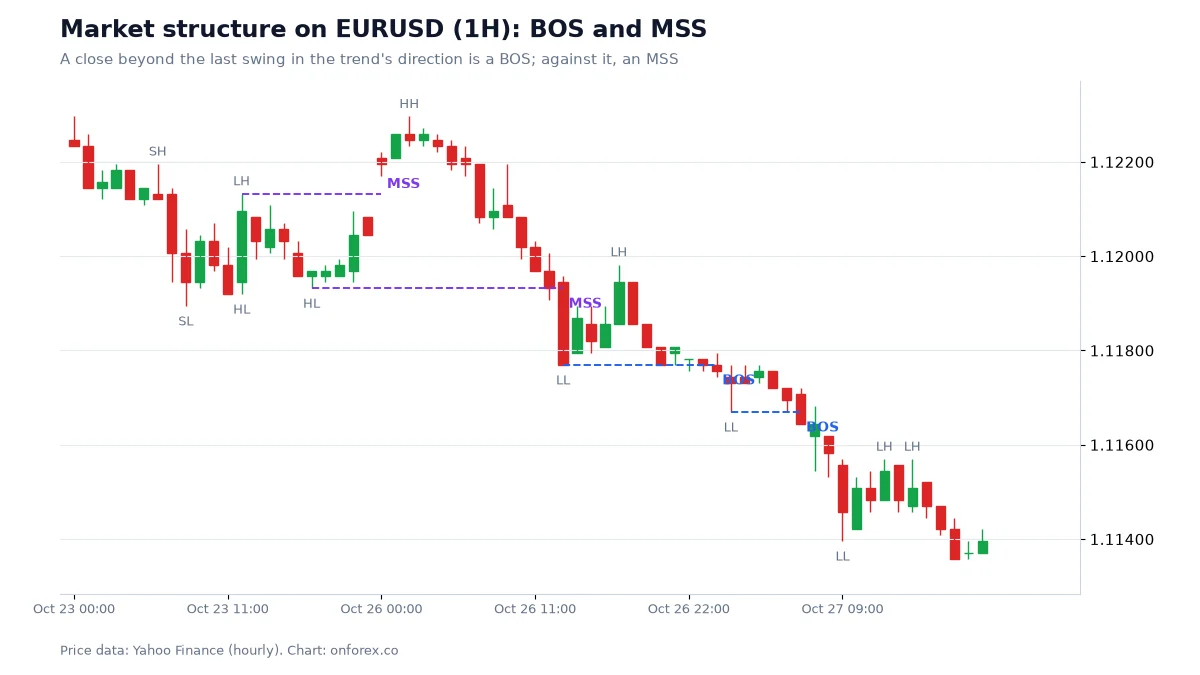
On this chart there is no textbook head and shoulders, but the sequence is the same: a high that is not exceeded, a lower high, then a close below the last higher low.
Inverse head and shoulders
| Head and shoulders | Inverse head and shoulders | |
|---|---|---|
| Appears after | An up-move | A down-move |
| Shape | Three highs, middle one highest | Three lows, middle one lowest |
| Neckline | Through the two lows between the highs | Through the two highs between the lows |
| Confirmation | Close below the neckline | Close above the neckline |
| Invalidation | Price trades back above the right shoulder | Price trades back below the right shoulder |
| SMC reading | Head sweeps BSL, LH, bearish MSS | Head sweeps sell-side liquidity, HL, bullish MSS |
Everything in this guide applies to both. For the inverse pattern, swap "high" and "low" and "above" and "below".
How to draw the neckline and the target
Neckline. Connect the two troughs. If they are at different levels the line slopes. A neckline sloping against the pattern (rising under a top) tends to give an earlier break; a neckline sloping with it gives a later one. Do not redraw the line once price touches it.
Pattern height. Measure vertically from the head to the neckline directly below the head.
Measured move. Project the pattern height from the point where price closes through the neckline. That is the textbook target.
Invalidation. The right shoulder. Once price trades back beyond it, the lower high is gone and so is the pattern. This is the most useful part of the pattern: it tells you exactly where you are wrong.
Worked example (illustrative numbers)
Suppose GBPUSD prints a left shoulder at 1.2750, a head at 1.2820 and a right shoulder at 1.2755. Both troughs sit at 1.2680, so the neckline is flat.
- Pattern height: 1.2820 - 1.2680 = 140 pips.
- Measured move: 1.2680 - 140 pips = 1.2540.
- A candle closes at 1.2670, below the neckline. A trader sells at 1.2670.
- Stop: above the right shoulder plus a 5-pip buffer, at 1.2760. Risk = 90 pips.
- Target distance: 1.2670 - 1.2540 = 130 pips, about 1.4R (R is the amount you risk).
Position size on a USD 1,000 account risking 1% (USD 10). GBPUSD pip value per standard lot is USD 10, so 10 / (90 x 10) = 0.011 lots, which is 0.01 lots after rounding down. A 90-pip stop leaves very little room in a small account, which is one reason many traders wait for a retest.
Retest variant. If price later rises back to the neckline at 1.2680 and is rejected, a sell there with the same stop above the right shoulder risks 80 pips for a 140-pip target, about 1.75R. The retest may never come, and a stop placed tighter than the right shoulder is a stop that the pattern itself does not justify. See risk-reward ratio and position sizing for the arithmetic.
Remember that stops are filled as market orders: around news and session opens, spreads widen and the fill can be worse than the stop price (slippage).
An honest example: a head and shoulders that failed
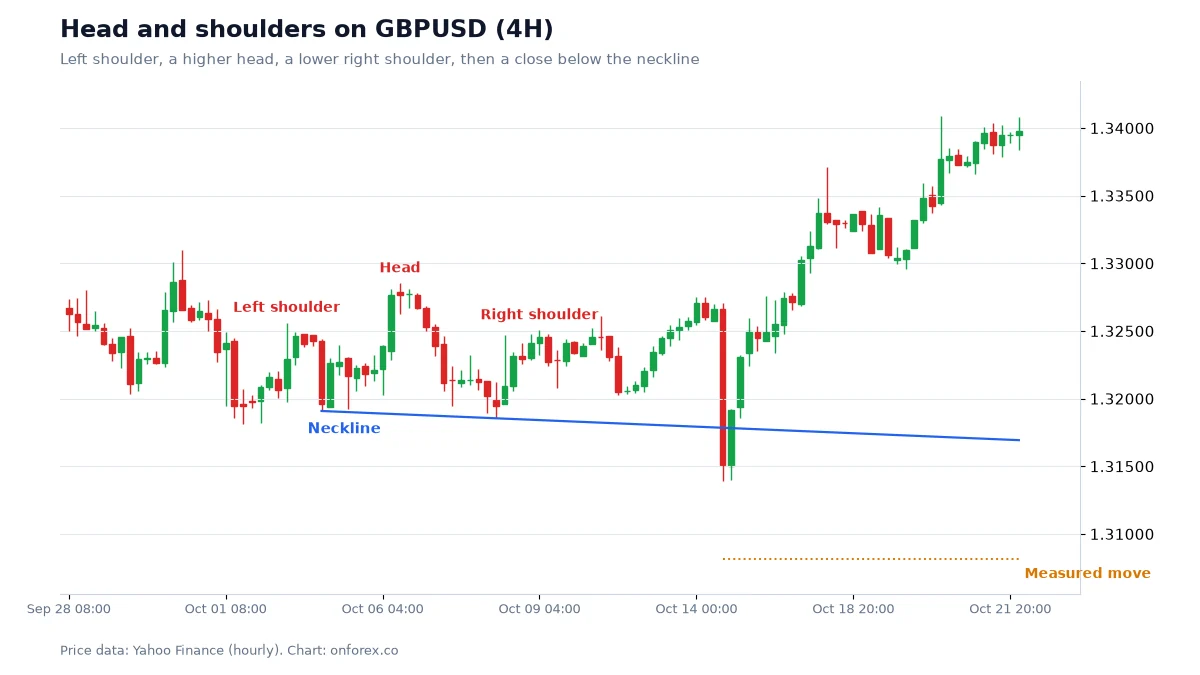
This is a clean-looking example. The left shoulder forms in early October, the head is clearly higher, the right shoulder is lower and close to the left shoulder in height, and the neckline slopes gently down. Around 14 October a large bearish candle closes below the neckline: by the book, a confirmed top.
Then the pattern fails. The next candles recover the neckline, price climbs back above the right shoulder within days, and GBPUSD goes on to trade near 1.34, well above the head. A trader who sold the break with a stop above the right shoulder took a full 1R loss. A trader who sold without a stop, expecting the measured move, would have been in a much worse position.
We show this example on purpose. Most published charts show the patterns that worked. The failed ones look exactly the same until after the break.
Our data: how often did the target get hit?
We scanned hourly and 4-hour prices for strict, objective head and shoulders patterns:
- three alternating swing highs (each the highest of 5 bars on each side);
- the head at least 1 ATR above both shoulders (ATR(14) is the average true range, a measure of typical bar size);
- the two shoulders within 0.6 ATR of each other;
- a neckline through the two troughs, confirmed by a close through it within 30 bars.
The outcome: was the measured move reached before price traded back beyond the right shoulder?
| Market | 1H tops | Target reached | 1H inverse | Target reached |
|---|---|---|---|---|
| EURUSD | 16 | 25.0% | 16 | 50.0% |
| GBPUSD | 18 | 27.8% | 16 | 31.2% |
| USDJPY | 18 | 50.0% | 26 | 42.3% |
| XAUUSD | 12 | 33.3% | 19 | 57.9% |
| Total | 64 | 22 cases (34%) | 77 | 35 cases (45%) |
Source: OnForex analysis of hourly prices from Yahoo Finance, January 2024 - October 2026 (gold: June 2024 - October 2026, COMEX gold futures). Before spreads and slippage.
On 4-hour charts we found only 1 to 6 per market, too few to say anything.
What the numbers show:
- Strict patterns are rare. About 141 in total across four markets and nearly three years of hourly data, which is roughly one per market per month. Chart screenshots make them look far more common because the rules are usually looser.
- The textbook target is not the usual outcome. It was reached in about a third of tops and under half of inverse patterns. In the rest, price went back beyond the right shoulder first.
- The samples are small. 12 to 26 cases per cell. A 50% figure from 16 cases is 8 cases; one or two different outcomes would move it a lot. Differences between markets here are within what chance produces.
This does not make the pattern useless. A 1.4R target that is reached a third of the time is not a winning plan, but a trade that is exited earlier, or managed with a trailing stop, is a different calculation. The reliable part is the invalidation: above the right shoulder, the idea is wrong.
Head and shoulders vs double top
| Double top | Head and shoulders | |
|---|---|---|
| Highs | Two at about the same level | Three, middle one highest |
| Neckline | One low, usually flat | Two lows, often sloped |
| Invalidation | Above the highs | Above the right shoulder |
| How common under strict rules | Very rare on 4H in our data | Rare on 1H, very rare on 4H |
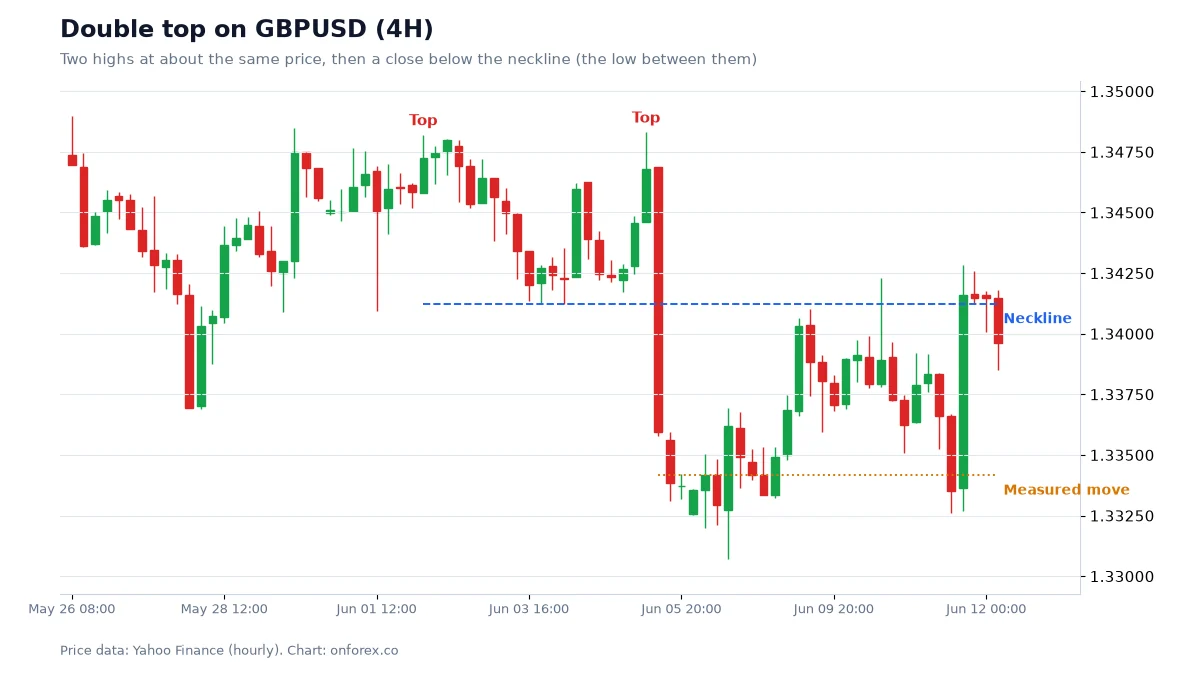
A head and shoulders has one practical advantage over a double top: the right shoulder is lower than the head, so the invalidation is closer than the pattern's highest point. That only helps if you actually place the stop there.
How traders use it
- Start with context. A top matters more after an extended up-move into a higher-timeframe resistance or supply zone. In the middle of a range it is just noise. See multi-timeframe analysis.
- Wait for the close. No neckline close, no pattern.
- Place the stop at the invalidation, beyond the right shoulder plus a buffer for spread.
- Size the position from the stop, not the other way round.
- Compare the target with the stop before entering. If the measured move is less than about 1R away, the pattern may not be worth trading.
- Decide the exit plan in advance: full target, partial profit and break-even, or a trailing stop.
Common mistakes
- Seeing the pattern before it exists. Three bumps are not a head and shoulders until the neckline closes.
- Loose shoulders. If the right shoulder is far higher or lower than the left, the shape is a different structure.
- Redrawing the neckline after price touches it, so the break "happens" where you want it.
- Treating the measured move as a promise. Our data says it is reached less than half the time.
- Stops inside the pattern. A stop just above the neckline is hit by ordinary retests.
- Trading every pattern against a strong trend. A head and shoulders in a strong uptrend is often just a pause.
Next steps
Find past head and shoulders patterns with fixed rules, record each outcome in R, and look at 30 or more before trusting your version. Then practise placing the neckline, stop and size on a demo account. Related guides: Wyckoff, support and resistance, candlestick patterns, stop-loss and backtesting.
Practise on a demo account first
Mark structure, FVGs and stops on a free Exness demo account before you risk money. Forex and CFD trading carries a high risk of loss.
Continue to ExnessForex and CFD trading involves significant risk. You may lose your invested capital.
Risk warning: Forex and CFD trading carries a high risk of loss and is not suitable for everyone. You can lose more than you deposit in some cases. The statistics on this page come from historical data under our own definitions and do not predict future results. This page is general education and not investment advice.
Related Articles

Double Top and Double Bottom: Neckline, Target, Retest
Double top and double bottom explained: neckline, measured move target, retest entries, head and shoulders, and our 4-hour data on 37 clean cases.

Forex Candlestick Patterns: 16 Key Patterns and How to Use Them
Forex candlestick patterns in one table: what 16 key patterns show, the confirmation to wait for, entry and stop rules and why patterns alone are weak.

How to Read Forex Charts: Complete Beginner's Guide 2026
Learn how to read forex charts step by step. Understand candlesticks, trend lines, support and resistance, and key chart patterns with practical examples.

Swing Trading Forex: Strategy, Holding Time and Our Data
Swing trading forex explained: how long swings last, how big they are in pips, a step-by-step swing trading strategy, swap and weekend risk, and sizing.
Technical Analysis in Forex: A Practical Guide With Data
Technical analysis in forex explained: trends, support and resistance, indicators, candlesticks and SMC, plus our own test of whether the signals beat chance.
Support and Resistance in Forex: How to Draw and Trade Levels
How to draw support and resistance zones in forex, with a worked EURUSD chart and our own test of prior-day highs, lows and round numbers on 4 markets.