Supply and Demand Zones: How to Draw, Trade and Test Them
Supply and demand zones explained: base and departure, how to draw a zone step by step, fresh vs tested zones, and how often zones held in our own 4H data.
This site contains affiliate links. We may earn a commission if you sign up through our links. How we research
Supply and demand zones are price areas where the market paused in a tight range and then left fast. A demand zone is the base under a sharp rally, watched as a place where buyers may step in again; a supply zone is the base above a sharp drop, watched as a place where sellers may return. In our 4H data, about a third of zones were never revisited, and of those that were, roughly 6 in 10 held on a simple test, so a zone is a place to plan a trade, not a reason to take one.
Disclosure: OnForex may earn a referral commission from Exness links on this page. This is general education, not investment advice.
This guide covers the logic behind supply and demand trading, how to draw a zone with a fixed rule, which zones are worth watching, how zones differ from order blocks and from support and resistance, a worked sizing example, and what our own price data says about how often zones held.
What are supply and demand zones?
Every currency price is the result of buy and sell orders meeting. When price moves away from a level very fast, the usual reading is that orders on one side were much larger than on the other at that moment. Supply and demand traders assume some of those orders were not completely filled and may still be waiting near the level. When price comes back, the remaining orders could slow it down or turn it.
You cannot see those orders on a retail chart, and spot forex has no central order book, so the story cannot be proven. What you can see is the footprint: a few small candles, then a burst. That footprint is what we draw.
Two parts make up every zone:
- Base: a short pause of small candles, where price moved sideways before the burst. In our test we used 1 to 3 consecutive candles, each with a range smaller than 0.7 x ATR(14). ATR (average true range) is the average candle range over the last 14 bars, so it scales the rule to each market's normal movement.
- Departure: the strong move out of the base. We required the next 3 candles to travel at least 2 ATR away from the base. A slow drift away does not count.
The four classic zone shapes
Traders often name zones by what happened before and after the base:
| Shape | Move into the base | Move out of the base | Zone type |
|---|---|---|---|
| Rally-base-rally (RBR) | Up | Up | Demand (continuation) |
| Drop-base-rally (DBR) | Down | Up | Demand (reversal) |
| Drop-base-drop (DBD) | Down | Down | Supply (continuation) |
| Rally-base-drop (RBD) | Up | Down | Supply (reversal) |
Our definition did not separate these shapes. It only asked whether a tight base was followed by a fast departure.
How to draw a supply and demand zone, step by step
- Spot the departure. Look for two or three large candles in a row that cover much more distance than the candles around them.
- Walk back to the base. Find the small candles right before the burst. If there are more than three, the pause was long and the zone is less clear.
- Draw the rectangle. Mark the highest high and lowest low of the base candles (wicks included). Some traders use bodies only for a tighter zone; pick one rule and keep it.
- Extend it to the right until price returns.
- Retire it when price closes through the far side. One close beyond the zone ends it. A wick that pokes through and closes back inside does not.
- Note the context. Is a demand zone below the middle of the current range, and a supply zone above it? See premium and discount. Does the zone agree with the higher time frame? See multi-timeframe analysis.
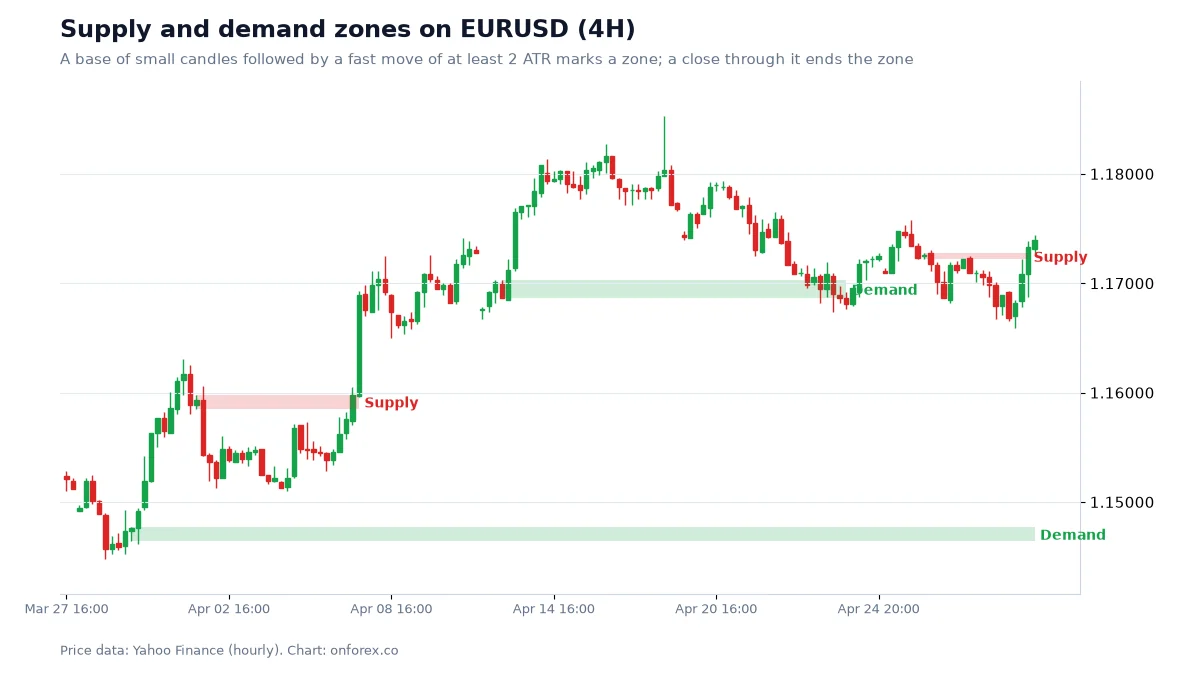
On this chart there are four zones. The lower demand zone near 1.147 formed at the start of a strong rally and price never came back to it in this window, so it stays drawn to the right edge. The first supply zone near 1.159 formed after a sharp drop in early April; price later rallied through it, which ended the zone. The second demand zone near 1.170 came from the base before the mid-April rally; price returned to it, bounced, then closed below it in late April. The last supply zone near 1.172 was broken by the rally on the final days. Four zones, four different outcomes: that variety is normal.
Fresh, tested and broken zones
Most supply and demand traders give the first return the most weight.
- Fresh zone: price has not been back since the departure. This is the zone most traders watch.
- Tested zone: price has traded into it once or more. Each visit can use up some of the remaining orders, and more traders now have stops just beyond it.
- Broken zone: price has closed through the far side. Many traders then watch it from the other side (old demand as possible resistance), similar to a breaker block.
Which zones are stronger?
There is no official scoring system. These are filters you can test on your own charts.
| Feature | Stronger | Weaker |
|---|---|---|
| Departure | Large bodies, little overlap, often leaves an FVG | Slow, overlapping candles |
| Base | 1 to 3 small candles | Long sideways period |
| Freshness | Not yet revisited | Touched several times |
| Location | Demand in discount, supply in premium | Middle of the range |
| Higher time frame | Agrees with 4H or daily direction | Against the larger trend |
| Room to the next zone | Clear space to the opposite zone | Opposite zone very close |
An FVG (fair value gap) is a three-candle gap left by a fast move; see fair value gap. The "room" row matters for reward to risk: if a supply zone sits just above your demand zone, the target is small compared with the stop. See risk-reward ratio.
Supply and demand vs order block vs support and resistance
The three ideas describe the same thing from slightly different angles: price may react where it reacted before.
| Supply and demand zone | Order block | Support and resistance | |
|---|---|---|---|
| What you mark | The whole base of small candles | One candle: the last opposite candle before a structure break | A level where price turned several times |
| Width | Medium | Narrow | A line or thin band |
| Needs a structure break | No | Yes | No |
| Strongest when | Fresh, first return | Fresh, first return | Tested several times |
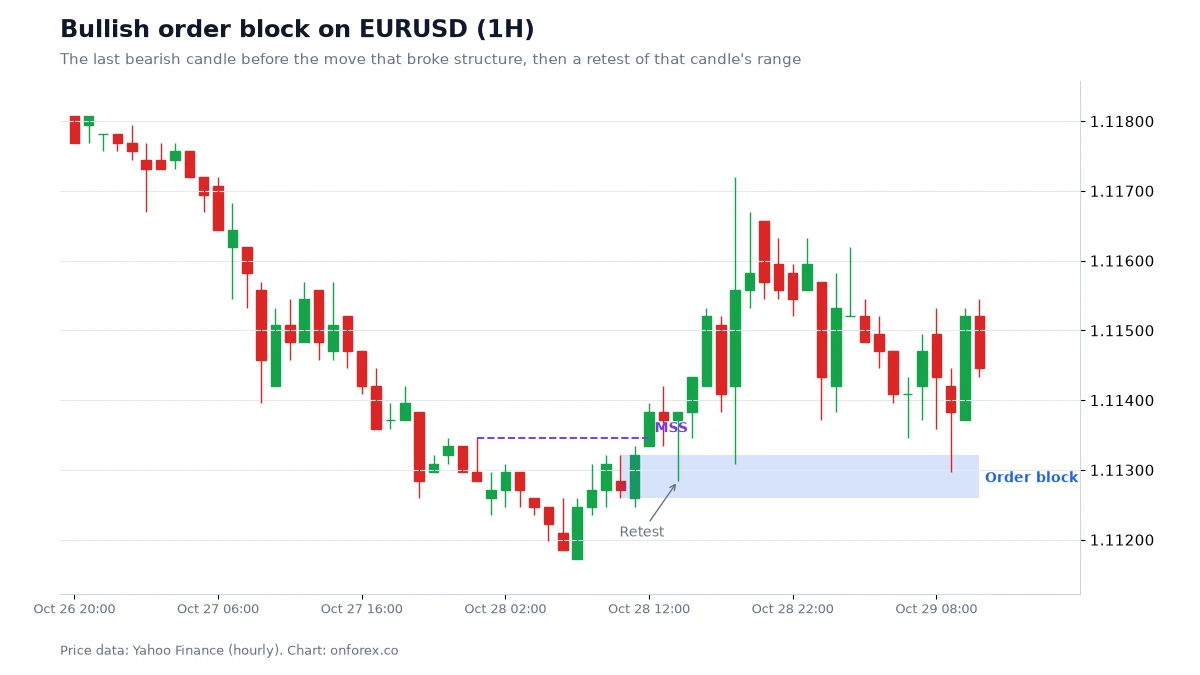
An order block is selected by the candle right before a break of structure, so it is usually a thinner slice inside or next to a supply and demand zone. Classic support and resistance works the other way round: more touches usually make a level more widely watched, while a supply and demand zone loses strength with every touch.
Entry methods
Traders usually pick one of three ways to use a zone:
- Limit order at the edge. Place a buy limit at the top of a demand zone (or a sell limit at the bottom of a supply zone) with the stop beyond the far side. You get the best price but you also get filled on every zone that fails.
- Confirmation on a lower time frame. Wait until price reaches the zone, then look for a shift in structure on a lower time frame, such as a break of the last lower high on 15-minute candles for a demand zone. You enter later and sometimes miss the move, but you skip some failures.
- Zone as a filter only. Use the zone to decide where you will not sell (above demand) or where you will look for longer trades, and let another method trigger the entry.
Whichever you use, put the stop beyond the far edge of the zone with a buffer. Stops placed exactly at the edge get touched by ordinary wicks, and around news or at the weekly open spreads can widen and stops can fill worse than set (slippage). See stop loss and slippage.
Worked example: sizing a demand zone trade
The numbers below are illustrative round figures, not a trade we took.
- A demand zone on EURUSD 4H is 20 pips tall.
- Entry: a buy limit at the top of the zone.
- Stop: below the zone plus a 5-pip buffer, so 25 pips from entry.
- Target: the nearest supply zone is 60 pips above, so a 2R target of 50 pips fits inside that room.
Account USD 1,000, risking 1% = USD 10. EURUSD pip value is USD 10 per standard lot, so lots = 10 / (25 x 10) = 0.04 lots. If the stop is hit you lose about USD 10 (1R) plus costs; if the target is hit you make about USD 20 (2R) minus costs.
Notice how the zone width drives the size. A wider zone means a wider stop and therefore a smaller position for the same risk. Our guides to position sizing and risk per trade explain this in full.
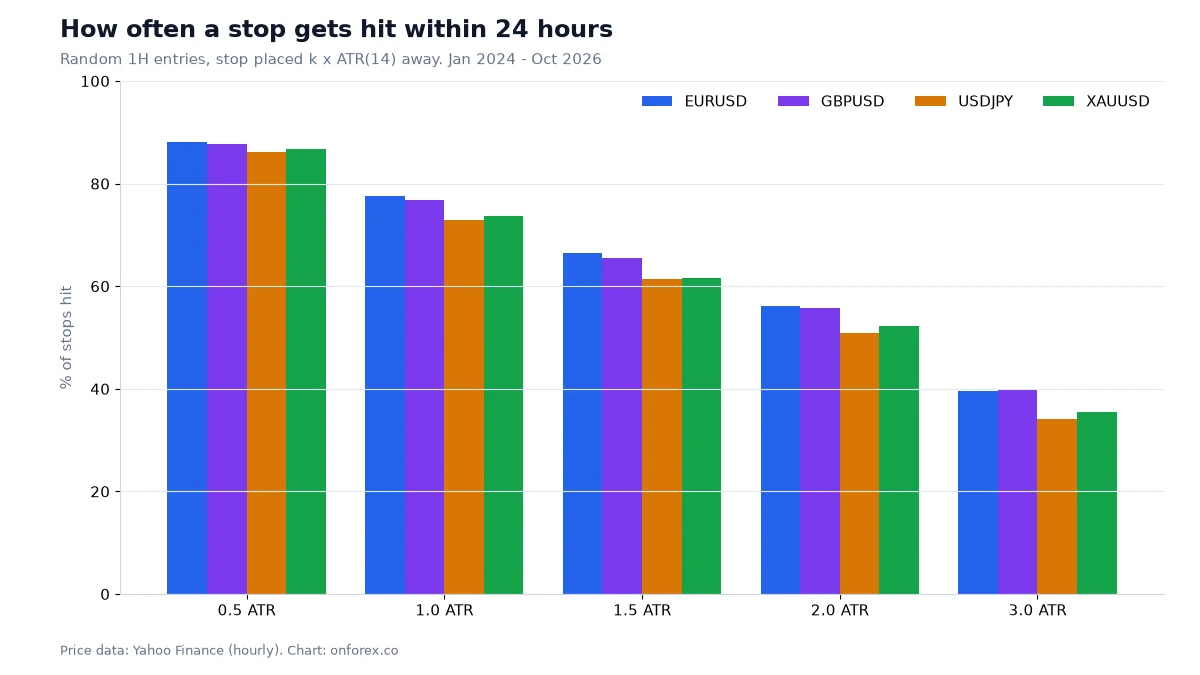
This chart is a reminder of why the stop buffer matters. After a random entry on hourly data, a stop 0.5 ATR away was hit within 24 hours 86-88% of the time across the four markets, and even at 1 ATR it was 73-78%. A stop tucked just beyond a zone edge sits inside normal noise.
Our data: how often did supply and demand zones hold?
We tested the definition above on 4H candles: a base of 1 to 3 candles each smaller than 0.7 x ATR(14), followed by 3 candles that moved at least 2 ATR away. The zone is the base high to low. Source: OnForex analysis of hourly prices from Yahoo Finance, January 2024 - October 2026 (gold: June 2024 - October 2026, COMEX gold futures), resampled to 4H.
| EURUSD | GBPUSD | USDJPY | XAUUSD | |
|---|---|---|---|---|
| Zones found | 119 | 132 | 96 | 86 |
| Price came back into the zone within 60 bars (10 trading days) | 65.5% | 64.4% | 59.4% | 64.0% |
| Of retested zones: price moved a further 1 ATR in the original direction before closing through the far side | 65.4% (n=78) | 57.6% (n=85) | 66.7% (n=57) | 69.1% (n=55) |
How to read it honestly:
- About a third of zones never got a retest within ten trading days. If you only trade limit orders at zones, many of your orders will never fill, and the best moves often leave without you.
- Of the zones that were retested, about 6 in 10 held on this simple test (57.6% to 69.1%). That is better than the order block hold rate we measured on 1H data (47.7% to 53.1%), but the two tests are not identical, so treat the comparison as a rough one.
- The samples are small. 55 to 85 retests per market is enough to see a tendency, not enough to rely on a precise number. A few different trades could move each figure by several points.
- No costs are included. Spreads, swap on multi-day holds and slippage on stops all reduce the result.
In short: zones gave a modest, unproven tilt in our data. They are useful for deciding where to plan and where to place a stop. They are not a signal by themselves.
Common mistakes
- Drawing too many zones. Every chart has dozens of pauses. Keep only bases followed by a clearly strong departure.
- Moving the edges after the fact. Choose wicks or bodies once and stick to it.
- Trading a zone that has been hit several times. By the third or fourth visit, the zone is more likely to break.
- Ignoring the room to the next zone. A demand zone with a supply zone 15 pips above it offers little reward for the stop you need.
- Fighting the higher time frame. A 1H demand zone in the middle of a strong 4H downtrend is a weak setup on most traders' own filters.
- Expecting a bounce every time. Our data says roughly 4 in 10 retested zones failed. Size every trade so that a loss is small.
How to practise
Pick one market and one time frame. Mark zones on past charts with a fixed rule, then record each one: no retest, held, or broken. After 50 or more examples, compare your rates with the table above. Then forward-test on a demo account before risking money. Related reading: Wyckoff method, Smart Money Concepts, price action and ATR indicator.
Practise on a demo account first
Mark structure, FVGs and stops on a free Exness demo account before you risk money. Forex and CFD trading carries a high risk of loss.
Continue to ExnessForex and CFD trading involves significant risk. You may lose your invested capital.
Risk warning: Forex and CFD trading carries a high risk of loss and is not suitable for everyone. You can lose more than you deposit in some cases. Past patterns, including those in this article, do not predict future results. Nothing here is investment advice.
Related Articles

Order Block: How to Mark It, Trade It and Test It
Order block explained: bullish and bearish OB, how to mark one step by step, mitigation, valid vs weak blocks, and how often OBs held in our own price data.

ICT Kill Zones: London, New York and Asia Times (UTC) With Data
ICT kill zones explained with times in UTC and New York time, how daylight saving shifts them, and our hourly range data for EURUSD, GBPUSD, USDJPY and gold.

Smart Money Concepts (SMC) Explained: ICT Basics and Our Data
Smart money concepts (SMC) explained: what ICT terms like BOS, order block and FVG mean, how a top-down read works, and what our own price data shows.
Breaker Block: What It Is and How It Differs From an OB
Breaker block explained: how a failed order block becomes a breaker, breaker vs mitigation block vs order block, how to mark one, and the risks of trading it.
Support and Resistance in Forex: How to Draw and Trade Levels
How to draw support and resistance zones in forex, with a worked EURUSD chart and our own test of prior-day highs, lows and round numbers on 4 markets.

Fibonacci Retracement in Forex: Levels, Drawing, Data
Fibonacci retracement for forex: how to draw it, what 38.2%, 50% and 61.8% mean, and what 1,135 pullbacks show about whether price really respects the levels.