Multiple Time Frame Analysis: Top-Down Analysis in Forex
Multiple time frame analysis explained: how top-down analysis works, which timeframes to combine, a step-by-step routine, and what our trend data showed.

This site contains affiliate links. We may earn a commission if you sign up through our links. How we research
Multiple time frame analysis is the habit of reading one market on several timeframes before trading it, usually from the top down: a higher chart for the trend and key levels, a middle chart for the setup, and a lower chart for the entry and stop. Top-down analysis is the name for doing this in order, highest first. It helps you see where you are in the bigger picture, but our data suggests that simply "trading with the higher timeframe" is not an edge by itself.
Disclosure: OnForex may earn a referral commission from Exness links on this page. This is general education, not investment advice.
This guide explains why timeframes disagree, which combinations traders use, a top-down routine you can repeat, and what we found when we tested 1-hour structure breaks against the 4-hour trend.
Why look at more than one timeframe?
Every chart is a slice of the same price. A strong 1-hour rally can be a small pullback inside a 4-hour downtrend. A clean 15-minute uptrend can be heading straight into a daily resistance. Looking at one chart only, you see the move but not its context.
Multiple timeframes answer three different questions:
| Role | Question it answers | Typical tools |
|---|---|---|
| Higher timeframe (HTF) | Which way is the main trend, and where are the big levels? | Swing structure, support and resistance, a slow moving average |
| Middle timeframe | Is there a setup here, such as a pullback to a level? | Pullbacks, supply and demand zones, premium and discount |
| Lower timeframe (LTF) | Exactly where do I enter and where is the idea wrong? | A small market structure break, candle patterns, stop placement |
The higher timeframe is sometimes called the bias (the direction you expect) and the lower one the execution chart. The middle chart is optional for some traders; two charts are enough if the higher one already shows clear levels. What matters is that each chart has one job, and that you do not ask the 5-minute chart to tell you the trend or the daily chart to tell you the entry.
Which timeframes to combine
A common guideline is to keep a factor of about 4 to 6 between charts. Too close (1 hour and 30 minutes) and the charts say the same thing. Too far (daily and 5 minutes) and the lower chart has too much noise to relate to the higher one.
| Style | Higher | Middle | Lower |
|---|---|---|---|
| Position trading | Monthly | Weekly | Daily |
| Swing trading | Daily | 4 hour | 1 hour |
| Day trading | 4 hour | 1 hour | 15 minute |
| Scalping | 1 hour | 15 minute | 1-5 minute |
Pick one row that fits the time you have and stay with it. Switching rows mid-trade, for example moving to the daily chart to justify holding a losing 15-minute trade, is a common way to turn a small loss into a big one.
A top-down routine, step by step
1. Higher timeframe: define the trend with one rule
Use a simple, repeatable definition. Two common ones:
- Structure: higher highs and higher lows mean up; lower highs and lower lows mean down. See Dow theory.
- Moving average: price above a rising 50 EMA means up; below a falling 50 EMA means down; anything else is neutral. EMA is an exponential moving average. See moving averages.
Then mark the last swing high and low and any major level nearby.
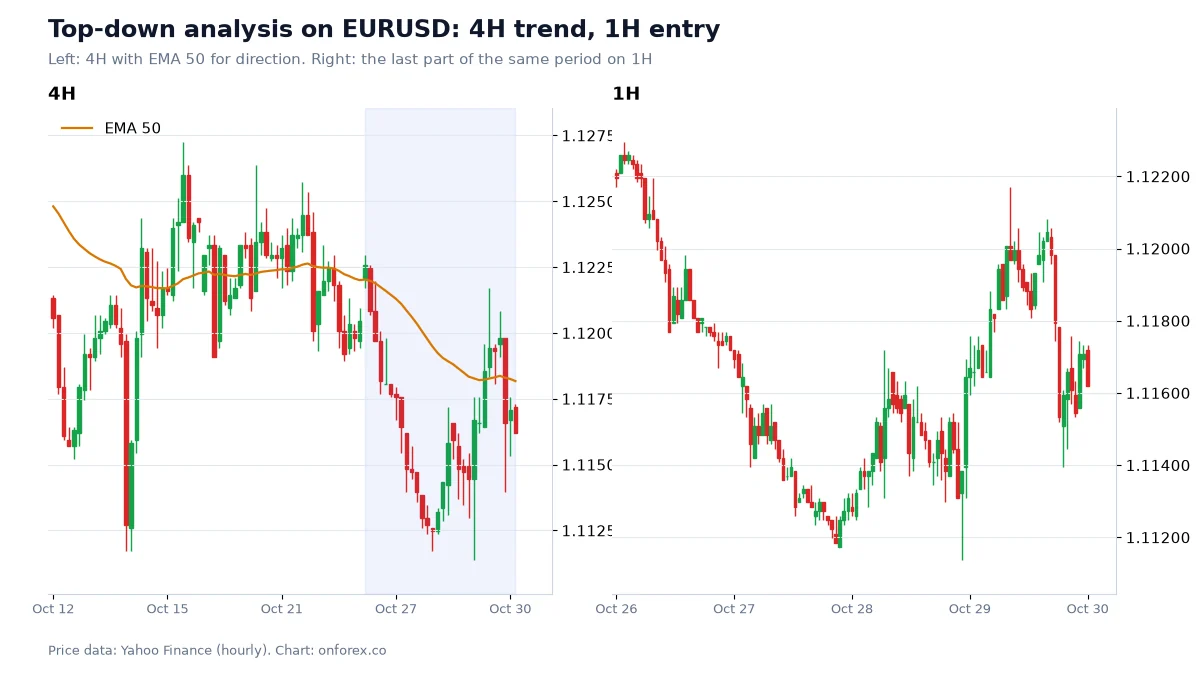
On the left, the 4-hour EMA was flat in mid-October while price moved sideways around it. From about 24 October, price closed below the line and the EMA turned down, so by our rule the 4-hour trend became "down". On the right, the same days on the 1-hour chart show what the 4-hour candles hide: a steady fall to about 1.1120 on 28 October, then a sharp rebound to about 1.1200 on 29 October, which carried price back up to the falling 4-hour EMA before it turned lower again.
A top-down reader would treat that 1-hour rebound as a counter-trend move inside a 4-hour downtrend. A reader who only had the 1-hour chart might have seen a new uptrend.
2. Middle timeframe: wait for price to reach a level
In a downtrend, wait for a rally into a level that makes sense to sell: a previous support now acting as resistance, the premium half of the last range, or a supply zone. In an uptrend, the mirror.
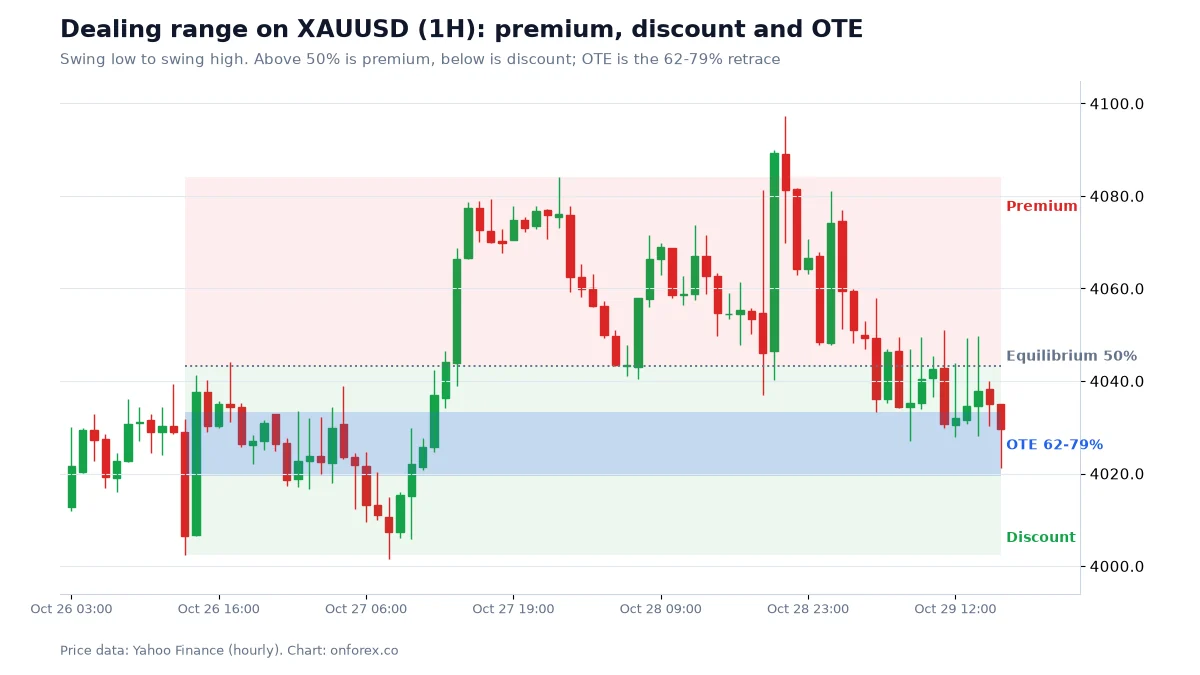
This chart shows one way to define "a level worth waiting for" on the middle chart. The range runs from the low near USD 4,002 to the high near USD 4,084. In an uptrend, a top-down trader would only look for buys in the lower (discount) half. Price returned to the 62-79% band on 29 October. Whether it would hold was unknown at that point; the level only tells you where to pay attention.
3. Lower timeframe: look for a trigger and a stop
When price reaches the level, drop to the lower chart and wait for evidence that the counter-move is ending, such as a break of the small structure in the direction of the higher trend. In SMC terms this is a lower-timeframe MSS (market structure shift).
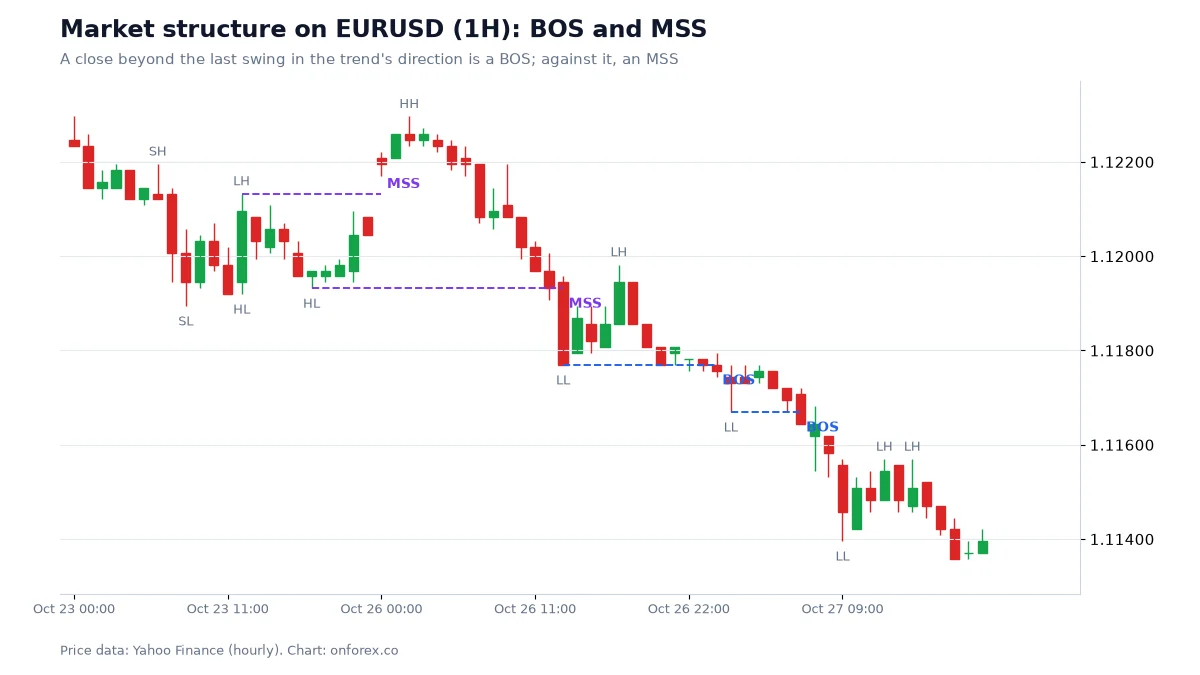
The lower chart gives you a precise invalidation point, here the last lower high, which is what makes a tighter stop possible. Our stop-loss guide explains buffers for spread and slippage.
4. Size from the lower-timeframe stop
The stop comes from the lower chart, so the position size does too. A tighter stop means a larger lot size for the same risk. Use position sizing and check the risk-reward ratio against the next higher-timeframe level, not an arbitrary number.
Our data: does trading with the 4-hour trend help?
The usual claim is that a lower-timeframe signal in the direction of the higher trend works better. We tested a simple version.
Signal: every 1-hour BOS or MSS (a close beyond the last swing high or low; swings are the highest or lowest of 3 bars on each side). Follow-through: price went a further 1 ATR (average true range, 14 bars) beyond the broken level before closing back through it, within 48 hours. 4-hour trend at that moment: up if the 4-hour close was above a rising 50 EMA, down if below a falling 50 EMA, otherwise neutral.
| Follow-through of 1H structure breaks | EURUSD | GBPUSD | USDJPY | XAUUSD |
|---|---|---|---|---|
| With the 4H trend | 66.8% (n=626) | 64.4% (599) | 60.3% (622) | 65.0% (506) |
| Against the 4H trend | 69.2% (597) | 59.8% (582) | 62.7% (502) | 62.9% (375) |
| 4H neutral | 62.7% (75) | 54.9% (82) | 61.2% (67) | 53.8% (52) |
Source: OnForex analysis of hourly prices from Yahoo Finance, January 2024 - October 2026 (gold: June 2024 - October 2026, COMEX gold futures); 4-hour bars are resampled from hourly. Before spreads and slippage.
The results are not what the textbook line suggests:
- On GBPUSD (+4.6 points) and gold (+2.1 points), breaks with the 4-hour trend followed through a little more often.
- On EURUSD and USDJPY, breaks against the 4-hour trend did slightly better.
- With 500 to 600 cases in each group, differences of 2 to 5 points are small. We would not call any of them reliable.
- Breaks while the 4-hour chart was neutral tended to follow through least, but those groups are small (52 to 82 cases).
Our reading: on this simple test, alignment with the 4-hour trend was not a free edge. That does not make top-down analysis useless. Its main value is elsewhere: it shows you where the big levels are, so you avoid buying straight into higher-timeframe resistance, and it gives you a framework to decide which lower-timeframe signals to ignore. The test also used a mechanical trend rule; your own reading of structure and levels is a different thing, and you should test it on your own records.
Common mistakes
- Too many timeframes. Five charts will almost always disagree somewhere. Two or three is enough.
- Using the higher chart to excuse a loss. If the lower-timeframe stop is hit, the trade is over. Do not move to the daily chart to find a reason to stay in.
- Entering on the lower chart without a level. A 5-minute break in the middle of nowhere is not a top-down setup.
- Ignoring opposite levels. A buy with the daily trend can still run into a 4-hour supply zone. Check the path to the target.
- Treating "with the trend" as a guarantee. Our data shows how small the difference can be. Keep the stop and size rules the same either way.
- Re-reading the higher chart every few minutes. The bias is set once, at the start of the session or the day, and changes only when the higher chart's structure changes.
Next steps
Choose one combination from the table, write your trend rule and your trigger rule in one sentence each, and go through 50 past setups on a chart, recording each in R. Then do the same routine live on a demo account. Related guides: smart money concepts, trend trading, pullback trading, price action and backtesting.
Practise on a demo account first
Mark structure, FVGs and stops on a free Exness demo account before you risk money. Forex and CFD trading carries a high risk of loss.
Continue to ExnessForex and CFD trading involves significant risk. You may lose your invested capital.
Risk warning: Forex and CFD trading carries a high risk of loss and is not suitable for everyone. You can lose more than you deposit in some cases. The statistics on this page come from historical data and our own definitions; they do not predict future results. This page is general education and not investment advice.
Related Articles

ChatGPT Trading: How to Use AI Chatbots for Trade Analysis
ChatGPT trading explained: good and bad uses of AI chatbots for forex, six prompt templates, a journal example with the maths, and how to verify.

Forex Trading Hours: Market Sessions in Your Local Time (2026)
Forex trading hours in GMT and local time for New York, London, Tokyo, Sydney, Dubai, Lagos, Nairobi, Mumbai, Manila, Jakarta and Kuala Lumpur, plus DST notes.

Risk Reward Ratio in Forex: R Multiples, Win Rate and Expectancy
Risk reward ratio explained with R multiples, the break-even win rate table, an expectancy formula with worked examples, and why a higher ratio is not always better.
Technical Analysis in Forex: A Practical Guide With Data
Technical analysis in forex explained: trends, support and resistance, indicators, candlesticks and SMC, plus our own test of whether the signals beat chance.

Double Top and Double Bottom: Neckline, Target, Retest
Double top and double bottom explained: neckline, measured move target, retest entries, head and shoulders, and our 4-hour data on 37 clean cases.

Martingale Strategy in Forex: Why It Blows Up (Simulation)
Martingale and averaging down explained: how doubling after a loss works, why accounts run out of room, our 20,000-run simulation, and safer ways to size.