Risk Reward Ratio in Forex: R Multiples, Win Rate and Expectancy
Risk reward ratio explained with R multiples, the break-even win rate table, an expectancy formula with worked examples, and why a higher ratio is not always better.
This site contains affiliate links. We may earn a commission if you sign up through our links. How we research
Risk reward ratio (also called reward-to-risk) is the distance from your entry to the profit target divided by the distance from your entry to the stop-loss. If you risk 20 pips to make 40, the ratio is 1:2, or 2R. It tells you how much a winner pays compared with what a loser costs, and you need it together with your win rate to know whether a method makes money at all.
Disclosure: OnForex may earn a referral commission from Exness links on this page. This is general education, not investment advice.
This guide explains R multiples, shows the break-even win rate for each ratio, gives the expectancy formula with worked examples, and covers why a bigger ratio does not automatically improve results. The charts use our own price data and one real trade plan.
Risk reward ratio in plain numbers
Take any trade and measure two distances in pips (or in price): the risk, from entry to stop-loss (SL), and the reward, from entry to take-profit (TP).
Risk reward ratio = reward distance / risk distance
| Entry | Stop | Target | Risk | Reward | Ratio |
|---|---|---|---|---|---|
| 1.1000 | 1.0980 | 1.1020 | 20 pips | 20 pips | 1:1 |
| 1.1000 | 1.0980 | 1.1040 | 20 pips | 40 pips | 1:2 |
| 1.1000 | 1.0980 | 1.1060 | 20 pips | 60 pips | 1:3 |
The same logic works for a short trade; only the direction flips. Note that the ratio uses planned levels. The result you actually get can differ, because spreads widen around news and market opens and stops can fill with slippage (a fill worse than your stop price).
R multiples: one unit for every trade
An R multiple measures a trade result in units of the amount you risked. Define 1R as the money lost if the stop is hit. Then:
- A full stop-out is -1R.
- Closing at your target of 2R is +2R.
- Closing at break-even (BE) is 0R.
- Closing at half the stop distance against you is -0.5R.
R makes trades comparable. Risking 10 USD on EURUSD and risking 100 USD on gold are different sizes, but "+2R" means the same thing for both. When you review a month, you add up R instead of pips, because pips are not comparable across pairs and stop sizes. For how to turn a risk amount into a lot size, see position sizing and the step-by-step example in risk per trade.
A real trade plan in R
The chart below shows a plan we marked on EURUSD 1H on 28 October 2026. The entry was at the top of a bullish order block (the last down candle before an upward move that broke structure) at 1.11321. The stop sat at 1.11247, about 7.4 pips away and below the block with a small ATR buffer (ATR is the average true range, a measure of recent volatility). The target was 1.11469, about 14.8 pips away, which is 2R.
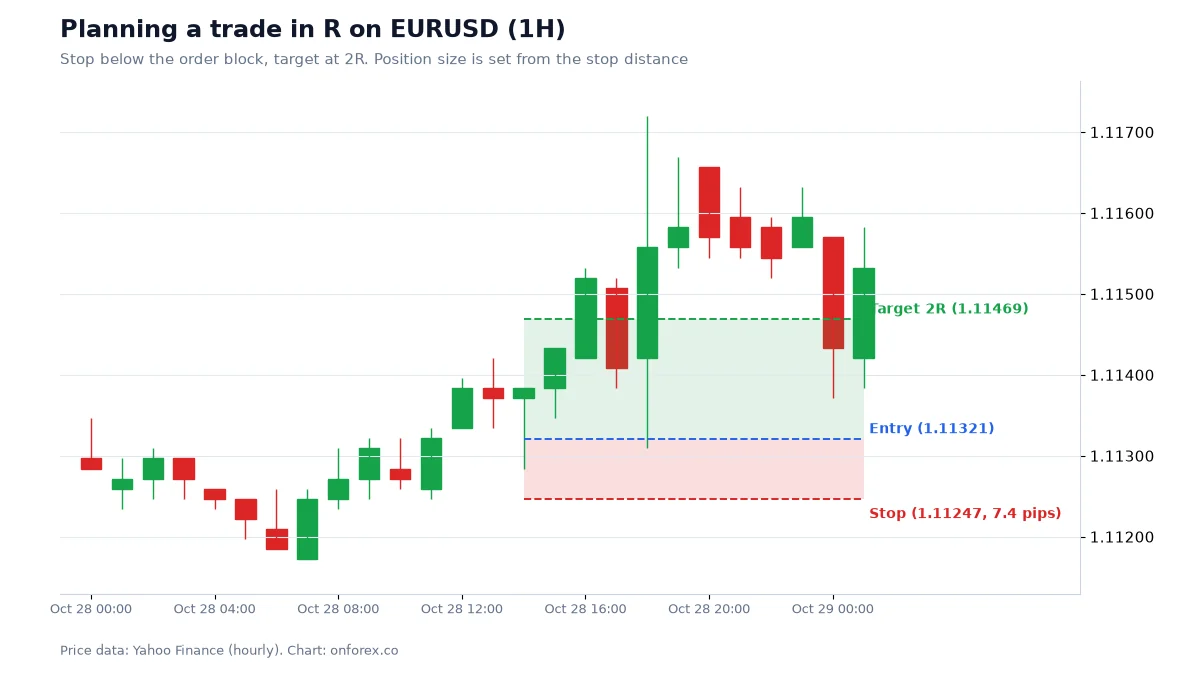
In this case price reached the target before the stop, so the trade booked +2R. That is one sample. Had the stop been hit first, the result would have been -1R, and the plan would have been just as valid.
Break-even win rate
For a fixed ratio, there is a win rate at which you neither gain nor lose, before costs:
Break-even win rate = 1 / (1 + R)
where R is the reward divided by the risk. At 1:1 you need to win half the time. At 1:2 you need one winner in three. The table puts costs in too, assuming spread and commission together take 0.1R per trade (for example 1 pip on a 10-pip stop).
| Ratio (risk:reward) | Break-even win rate, no costs | With costs of 0.1R |
|---|---|---|
| 1:0.5 | 66.7% | 73.3% |
| 1:1 | 50.0% | 55.0% |
| 1:1.5 | 40.0% | 44.0% |
| 1:2 | 33.3% | 36.7% |
| 1:3 | 25.0% | 27.5% |
With costs c (in R) the formula becomes (1 + c) / (1 + R). Costs matter most when the stop is small: a 1-pip cost is 0.1R on a 10-pip stop but 0.33R on a 3-pip stop.
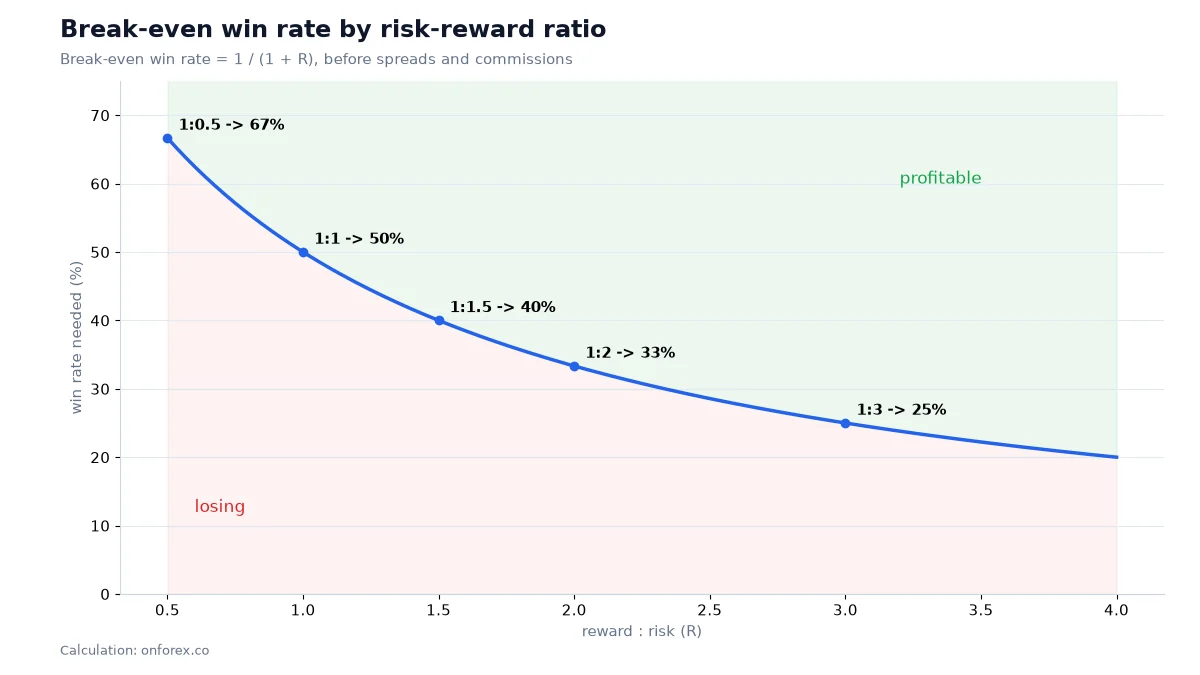
The curve is the first thing to notice: moving from 1:1 to 1:2 cuts the required win rate by about 17 points, but moving from 1:2 to 1:3 cuts only 8. Each step up buys less.
Expectancy: the formula that puts it together
Expectancy is the average result per trade, measured in R:
Expectancy = (win rate x average win in R) - (loss rate x average loss in R)
With a fixed 1R loss, that is W x R - (1 - W), where W is the win rate and R the reward in multiples of the risk.
| Win rate | Ratio | Calculation | Expectancy per trade |
|---|---|---|---|
| 45% | 1:1.5 | 0.45 x 1.5 - 0.55 | +0.125R |
| 60% | 1:0.5 | 0.60 x 0.5 - 0.40 | -0.100R |
| 35% | 1:2 | 0.35 x 2 - 0.65 | +0.050R |
| 25% | 1:3 | 0.25 x 3 - 0.75 | 0.000R |
| 20% | 1:5 | 0.20 x 5 - 0.80 | +0.200R |
Three lessons come out of this table. A 60% win rate can lose money if the winners are small. A 35% win rate can make money if winners are twice the size of losers. And the 25% / 1:3 line sits exactly on the break-even curve, so it is not an edge by itself.
Turning expectancy into money
Suppose you risk 1% of a 1,000 USD account, so 1R = 10 USD. The first row gives +0.125R x 10 USD = +1.25 USD per trade on average. Over 200 trades that is about +250 USD, or +25% before compounding. It is an average, not a promise. In our simulation of exactly this setup (45% win rate, 1.5R reward, 200 trades, 20,000 runs), about 8.9% of runs still ended below the starting balance at 1% risk, because the order of wins and losses matters. See drawdown for what that path looks like.
What the costs do
Now subtract costs. If spread plus commission equal 0.1R per trade, the first row falls from +0.125R to +0.025R, a drop of 80%. The 35% / 1:2 row goes from +0.05R to -0.05R. A small positive edge can disappear entirely, which is why tight stops on scalping setups need an honest cost estimate. Our guide to scalping strategy and the page on slippage cover this in more detail.
Why a higher ratio is not automatically better
It is tempting to aim for 1:5 everywhere, because the break-even win rate is only 17%. The problem is that win rate and ratio are linked: the farther the target, the less often price gets there before your stop.
A thought experiment shows the limit. Imagine price moving with no direction at all (a random walk) and costs of zero. The chance of reaching a target that is R times your stop distance before the stop is exactly 1 / (1 + R). That is the same as the break-even win rate, so every ratio has an expectancy of zero. In that world the ratio changes only how often you win, not whether you profit. Real markets are not perfectly random, and costs are not zero, so any real edge has to come from something other than the ratio: where you place the stop and target relative to structure, and when you trade.
Tight stops get hit a lot
The other half of the story is stop placement. We took random entries on four markets and counted how often a stop at k x ATR(14) was hit within 24 hours. The wider the stop, the less often it is hit.
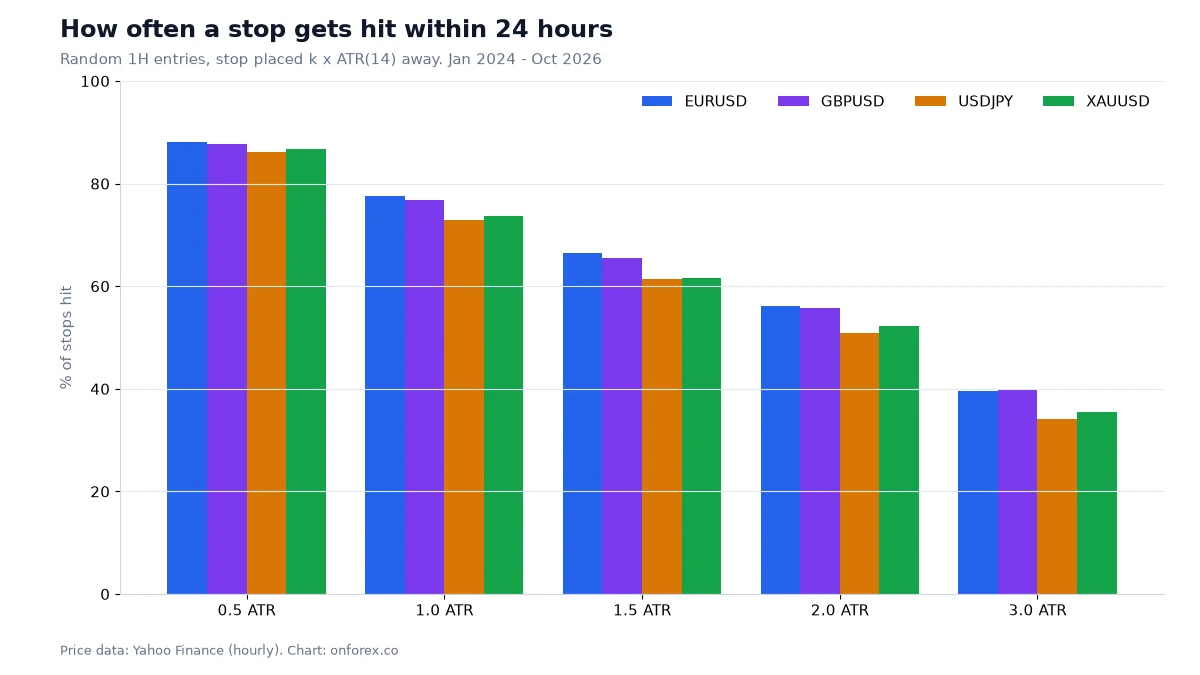
For EURUSD the stop was hit in 88% of random entries at 0.5 ATR, 78% at 1 ATR, 66% at 1.5 ATR, 56% at 2 ATR and 40% at 3 ATR. USDJPY was a little lower (86%, 73%, 61%, 51%, 34%) and gold sat between the two (87%, 74%, 62%, 52%, 35%). So a very tight stop to "improve" the ratio makes the stop-out very likely. It only helps if your entry has a real reason to hold the level, and our other data show that common SMC locations such as order blocks held about half the time, so they are places to watch, not guarantees. See order block and stop-loss.
Our data source: OnForex analysis of hourly prices from Yahoo Finance, January 2024 - October 2026 (gold: June 2024 - October 2026, COMEX gold futures). A random entry is an entry at an arbitrary time with no signal behind it, so this measures how far price moves, not how well a method works.
How to choose a ratio for your plan
- Write down the stop first. Put it where the idea is wrong (beyond structure, plus a buffer for noise and spread), not where it gives a nice ratio.
- Put the target at a level the market can reach, such as the previous swing or the opposite end of a range. See support and resistance.
- Measure the ratio. If it is below your minimum, skip the trade. Do not move the target to make it fit.
- Check the break-even win rate for that ratio including costs, and compare it with your tested win rate on at least 100 trades.
- Record each trade in R and update the expectancy every month.
Partial profit-taking (closing a part at 1R and moving the stop to break-even) changes the shape of your results, but it does not make a bad setup good. If you use it, record the real average R, not the planned one.
Common mistakes
- Chasing 1:5 on every trade. The win rate falls, losing streaks lengthen, and discipline breaks first.
- Ignoring the spread. On a 5-pip stop, a 1-pip spread is 0.2R before any slippage.
- Moving the stop away. Widening the stop after entry turns a planned 1R loss into 2R or more and ruins the ratio you calculated.
- Using win rate alone. "I win 70% of my trades" says nothing without the size of winners and losers.
- Judging the plan on 10 trades. At a 45% win rate, losing streaks of 8 are normal over 200 trades, so small samples mislead. See psychology.
- Mixing planned and real R. Calculate expectancy from the R you actually got, including partial exits and slippage.
What our data says
Across EURUSD, GBPUSD, USDJPY and gold, a random entry with a 1 ATR stop was hit within 24 hours 73-78% of the time. A random entry has no edge, so this is the baseline any real method must beat after costs. The R framework tells you what you need; it cannot tell you whether you have it. Only a tested, honest sample can.
Related guides
- Position sizing and risk per trade: how many lots 1R is.
- Drawdown: what a string of -1R trades does to an account.
- Money management and risk management: the wider framework.
- Stop-loss: where to place the stop that defines 1R.
Practise on a demo account first
Mark structure, FVGs and stops on a free Exness demo account before you risk money. Forex and CFD trading carries a high risk of loss.
Continue to ExnessForex and CFD trading involves significant risk. You may lose your invested capital.
Risk warning: Forex and CFD trading carries a high risk of loss, and you can lose more than you deposit with some products. A positive expectancy in past or simulated data does not guarantee future profit. Nothing here is a recommendation to trade. Test any method on a demo account first.
Related Articles
Stop Loss in Forex: Where to Place It (ATR, Structure, Pips)
Where to place a forex stop loss: structure-based, ATR-based and fixed-pip stops compared, how stop distance sets lot size, slippage, gaps, trailing and BE.
Trailing Stop Loss in Forex: Trailing, Break Even and Partial TP
How a trailing stop loss works in forex, plus break even stops and partial take profit, compared on the same EURUSD entries with our own test data.
RSI Indicator: Settings, Strategies and What Our Data Shows
RSI indicator guide: Wilder's formula, the 14 setting, overbought and oversold levels and divergence, with tests on four markets of what RSI can do.
Forex Risk Management: How to Calculate Risk per Trade
Forex risk management step by step: calculate lot size from a 1% risk and a stop-loss, with USD 1,000 and USD 2,000 EUR/USD examples, drawdown and analytics.

Pivot Points in Forex: Formula, Levels and Touch Rates
Pivot points explained: the floor formula with a worked example, Camarilla and Fibonacci pivots, how traders use them, and how often price touched them.

Forex Money Management: Rules, Trade Management and Examples
Forex money management with worked numbers: risk per trade, loss limits, drawdown rules, compounding, plus trade management with BE and trailing stops.