Order Block: How to Mark It, Trade It and Test It
Order block explained: bullish and bearish OB, how to mark one step by step, mitigation, valid vs weak blocks, and how often OBs held in our own price data.
This site contains affiliate links. We may earn a commission if you sign up through our links. How we research
An order block (OB) is the last candle of the opposite colour before a sharp move that breaks market structure: the last down candle before a bullish break, or the last up candle before a bearish break. Traders mark that candle's range as an area where price may react when it returns. In our data the return happens often, but the reaction is only about 50/50, so treat an order block as a place to look, not a reason to enter.
Disclosure: OnForex may earn a referral commission from Exness links on this page. This is general education, not investment advice.
This guide shows how to mark an order block, what separates a strong one from a weak one, what "mitigation" means, how an OB differs from a classic supply and demand zone, and what our own hourly data says about how often these zones held.
What is an order block?
The idea comes from the Smart Money Concepts (SMC) and ICT (Inner Circle Trader) style of reading charts. The claim is that large participants cannot fill a big position at one price, so they build it in steps, and the last opposite candle before the move marks where a lot of orders were filled. Nobody can verify that story from a retail chart. What you can verify is the pattern: price moved away fast from one candle, and it left a zone behind.
Two terms first, because the definition depends on them:
- Market structure is the sequence of swing highs and swing lows. A swing high is a high with lower highs on both sides, and a swing low is the mirror image. If you want the full picture, read our guide to market structure.
- BOS (break of structure) is a close beyond the last swing point in the direction of the trend. MSS (market structure shift) is the first close beyond a swing point against the prior trend. The order block is defined by the candle that sits right before such a break.
Bullish and bearish order blocks
| Bullish OB | Bearish OB | |
|---|---|---|
| Candle | Last down (bearish) candle | Last up (bullish) candle |
| Followed by | Strong up-move that closes above a swing high | Strong down-move that closes below a swing low |
| Watched as | Possible support when price pulls back | Possible resistance when price rallies |
| Zone to mark | Candle high to candle low (or open to low) | Candle low to candle high (or open to high) |
Many traders mark the full candle including wicks; others use only the body (open to close). Pick one rule and use it every time, otherwise you will redraw zones to fit the story afterwards.
How to mark an order block, step by step
- Find the break. Locate a candle that closes beyond a clear swing high or swing low. A wick through the level does not count.
- Find the origin of the leg. Walk back from the break to where the move started, the swing low (for a bullish break) or swing high (for a bearish one).
- Pick the last opposite candle. Near that origin, take the last candle that closed against the move. That is your order block.
- Draw the zone from its high to its low, and extend the rectangle to the right until price returns.
- Add a buffer for the stop. Put the stop beyond the far edge of the zone with some room. We use 0.2 x ATR(14), where ATR (average true range) is the average candle range over the last 14 bars, because spreads and stop-run wicks often poke past a clean edge.
- Check the context. Is the zone in the cheaper half of the current range for a buy, or the more expensive half for a sell? See premium and discount.
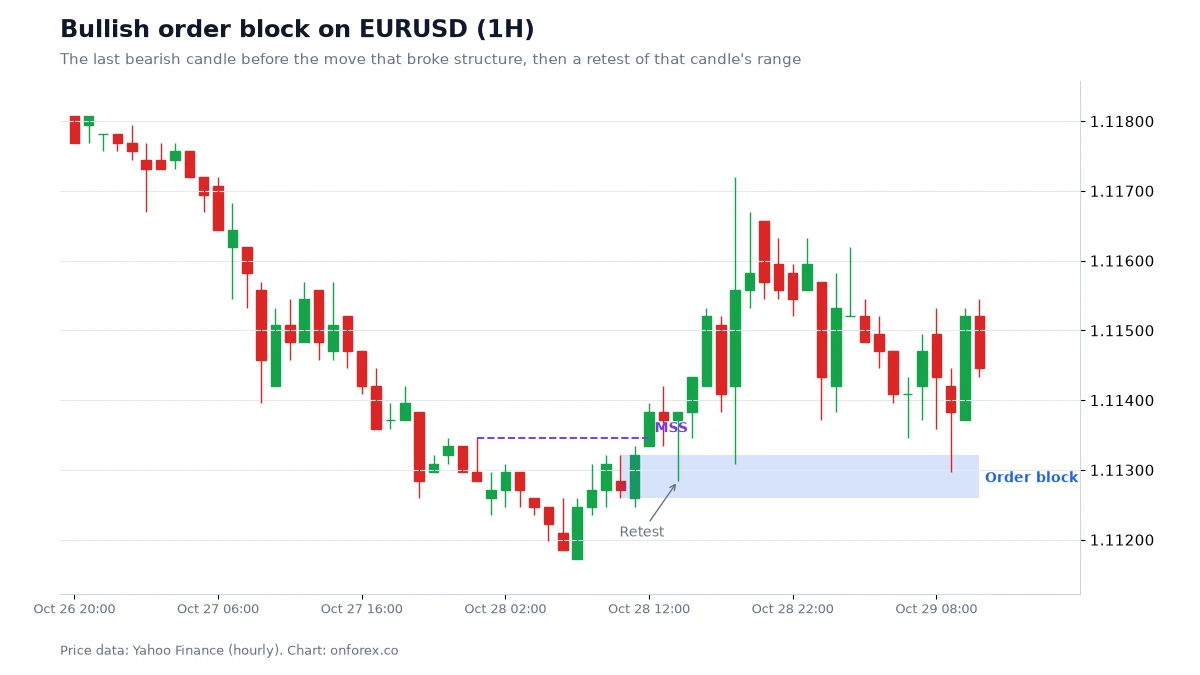
On the chart, the rectangle is the last bearish candle before the up-move that broke the swing high. Price ran away, came back to the rectangle, and reacted near its top. That is the textbook outcome. The next sections explain why it does not always go that way.
Mitigation: what it means and why it matters
Mitigation means price has returned into the order block after the original move. There are two common uses of the word:
- Touch: price trades into the zone. Many traders count the block as "mitigated" from this point and expect a fresh reaction only once.
- Close through: price closes beyond the far side of the zone. The block has failed, and what you do with it next is the topic of breaker blocks.
In practice, the first touch is the one most traders watch. If you see a zone that price has already tagged two or three times, its value is lower, because each visit is a chance for the same orders to be used up and for new traders to have placed stops just beyond it.
Valid vs weak order blocks
There is no official checklist, so treat these as filters you can test yourself rather than rules.
| Feature | Stronger | Weaker |
|---|---|---|
| Break of structure | Candle closes clearly beyond the swing, with large bodies | Marginal close, long wicks, small bodies |
| Displacement | Fast move leaving an FVG behind | Slow grind, overlapping candles |
| Liquidity | A liquidity sweep happened just before | No obvious level was taken |
| Location | Pullback into discount for a buy, premium for a sell | Zone sits in the middle of the range |
| Freshness | Price has not been back since | Already touched several times |
| Higher time frame | Agrees with the 4H or daily direction | Fights the larger trend |
An FVG (fair value gap) is a three-candle imbalance; see fair value gap. Order blocks that sit inside or next to an FVG are popular because the gap shows how fast the move was.
Order block vs supply and demand zone
They overlap heavily, and a fair question is whether "order block" is just a new name for supply and demand. The differences are mostly about how the zone is drawn.
| Order block | Supply and demand zone | |
|---|---|---|
| Size | One specific candle | A base of one or more candles |
| Selection rule | Last opposite candle before a structure break | Area of consolidation before a strong move |
| Needs a structure break | Yes | Not always |
| Typical use | Intraday retests with tight stops | Wider zones, often on higher time frames |
If you already trade support and resistance or supply and demand, an OB can be seen as a narrower, rule-based version of it. The tighter zone lets you use a smaller stop, but it is also easier to be stopped by one wick.
A worked example in R
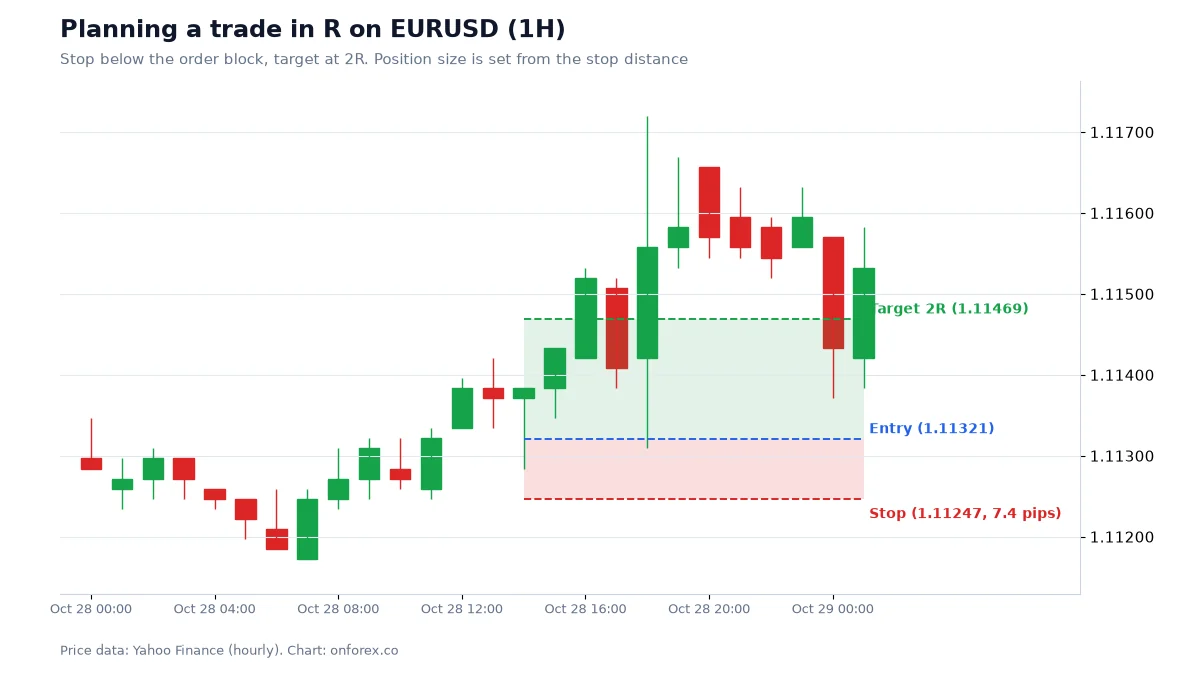
Here is the trade plan we drew on EURUSD 1H on 28 October 2026 at 14:00 UTC. It is an example of how to size a plan, not a signal and not a recommendation.
- Entry: 1.11321, the top of a bullish OB
- Stop: 1.11247, below the block with a 0.2 x ATR buffer, a distance of 7.4 pips
- Target: 1.11469, which is 2R
R is your risk on the trade: if the stop is hit you lose 1R, and a target twice as far away is worth 2R. On this example the target was reached before the stop. One trade proves nothing, and we picked it as an illustration of the maths.
Sizing for a USD 1,000 account risking 1%: risk is USD 10. On EURUSD one pip is USD 10 per standard lot, so lots = 10 / (7.4 x 10) = 0.13 lots. Our guides to position sizing and pip value show the formula in full.
Note that the stop is only 7.4 pips. During news or at the session open, spreads can widen and a stop can fill worse than the price you set (slippage). A tight stop makes both effects a larger share of your risk.
Our data: how often did order blocks hold?
We tested the definition above on hourly prices. Swings are the highest or lowest of three bars on each side, and the order block is the last opposite candle before the leg that broke structure. Source: OnForex analysis of hourly prices from Yahoo Finance, January 2024 - October 2026 (gold: June 2024 - October 2026, COMEX gold futures).
| EURUSD | GBPUSD | USDJPY | XAUUSD | |
|---|---|---|---|---|
| BOS/MSS events with an order block | 1,155 | 1,175 | 1,117 | 887 |
| Price came back to the OB within 48h | 82.3% | 81.2% | 84.4% | 79.6% |
| After touching, OB held (vs closing through it) | 49.7% | 47.7% | 53.1% | 50.4% |
"Held" means price went on to revisit the high or low of the leg before closing through the block.
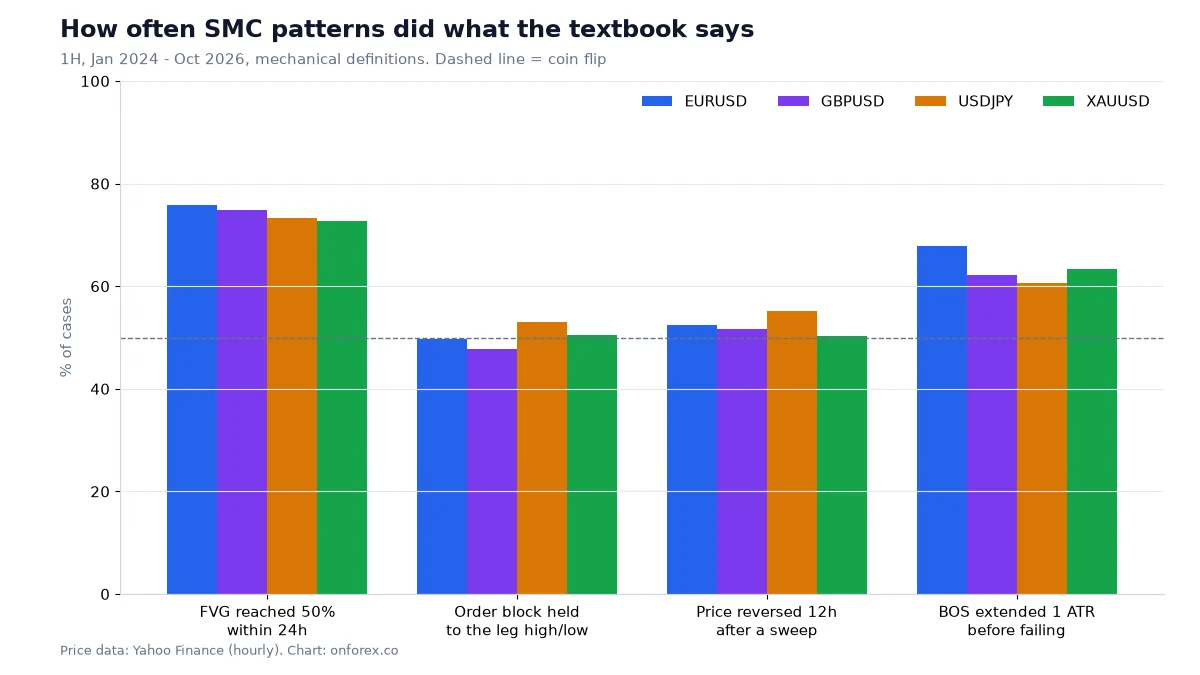
Two readings are honest. First, price returns to an order block about four times out of five within two days. That is useful for planning, because you can wait for a price instead of chasing. Second, once it arrives, the block held about as often as it failed: 47.7% to 53.1% across the four markets. A coin flip is not an edge. If you trade OBs, the edge, if there is one, has to come from the filters above and from the ratio of reward to risk, not from the zone itself.
Common mistakes
- Marking every candle. If a zone is found after the fact on every move, the chart is full of rectangles and none of them mean anything. Mark only blocks tied to a clear structure break.
- Changing the rule to fit. Switching between body and wick, or between "last candle" and "second-last candle", until it looks right is hindsight.
- Ignoring the stop. An order block without a stop beyond its far side is a hope. Size the position from the stop, not the other way round. See risk per trade.
- Trading against the higher time frame. A bullish OB inside a clear downtrend on the 4H is a weak setup by most traders' own filters.
- Treating the first touch as certain. Our data says about half hold. Plan for the other half.
How to practise
Mark order blocks on past charts first, using one fixed rule, and record each result in R in a spreadsheet: held, failed, no return. After 30 to 50 examples you will have your own hold rate and can compare it with ours. Then forward-test on a demo account. Related reading: Smart Money Concepts, price action and stop loss.
Practise on a demo account first
Mark structure, FVGs and stops on a free Exness demo account before you risk money. Forex and CFD trading carries a high risk of loss.
Continue to ExnessForex and CFD trading involves significant risk. You may lose your invested capital.
Risk warning: Forex and CFD trading carries a high risk of loss and is not suitable for everyone. You can lose more than you deposit in some cases. Past patterns, including those in this article, do not predict future results. Nothing here is investment advice.
Related Articles
Smart Money Concepts (SMC) Explained: ICT Basics and Our Data
Smart money concepts (SMC) explained: what ICT terms like BOS, order block and FVG mean, how a top-down read works, and what our own price data shows.
Breaker Block: What It Is and How It Differs From an OB
Breaker block explained: how a failed order block becomes a breaker, breaker vs mitigation block vs order block, how to mark one, and the risks of trading it.
Supply and Demand Zones: How to Draw, Trade and Test Them
Supply and demand zones explained: base and departure, how to draw a zone step by step, fresh vs tested zones, and how often zones held in our own 4H data.
Divergence in Forex: Regular and Hidden RSI/MACD Guide
Divergence explained: regular and hidden RSI and MACD divergence, how to spot it, why it fails, and what 965 cases in our own price data showed.
Pin Bar: How to Spot, Trade and Test a Pin Bar Candle
Pin bar explained: bullish and bearish pin bar rules, where they matter, a worked trade with stop and sizing, plus how pin bars performed in our 4-market data.
Engulfing Pattern: How to Read and Test Engulfing Candles
Engulfing pattern explained: bullish and bearish engulfing rules, context, a worked example with stop and sizing, and how it performed in our 4-market data.