Breaker Block: What It Is and How It Differs From an OB
Breaker block explained: how a failed order block becomes a breaker, breaker vs mitigation block vs order block, how to mark one, and the risks of trading it.

This site contains affiliate links. We may earn a commission if you sign up through our links. How we research
A breaker block is an order block that has failed. Price closes through the zone, and the zone is then watched from the other side: a bullish order block that price breaks down through becomes a possible resistance when price comes back up to it, and the reverse for a failed bearish block. It is a way to describe a zone that changed roles, not a prediction, and we have not measured how often breakers work.
Disclosure: OnForex may earn a referral commission from Exness links on this page. This is general education, not investment advice.
This page explains how a breaker forms, how it differs from an order block and from a mitigation block, how to mark one on a chart, and what to be careful about. If order blocks are new to you, read our guide to the order block first.
How a breaker block forms
Start with a normal order block: the last opposite candle before a move that broke structure. We use BOS (break of structure) for a close beyond a swing point with the trend, and MSS (market structure shift) for the first close beyond a swing point against the prior trend. See market structure.
The sequence for a bearish breaker is:
- A bullish order block forms and price moves up from it.
- Price returns, but this time closes below the order block. The block has failed.
- Often price also breaks the swing low that held above the block, a shift in structure.
- Later, price rallies back up into the broken zone from below.
- Traders watch that zone as possible resistance, because buyers who were in the block are now underwater and may sell to get out near their entry.
The bullish breaker is the mirror image: a failed bearish order block, followed by a rally through it, and then a pullback into the zone from above.
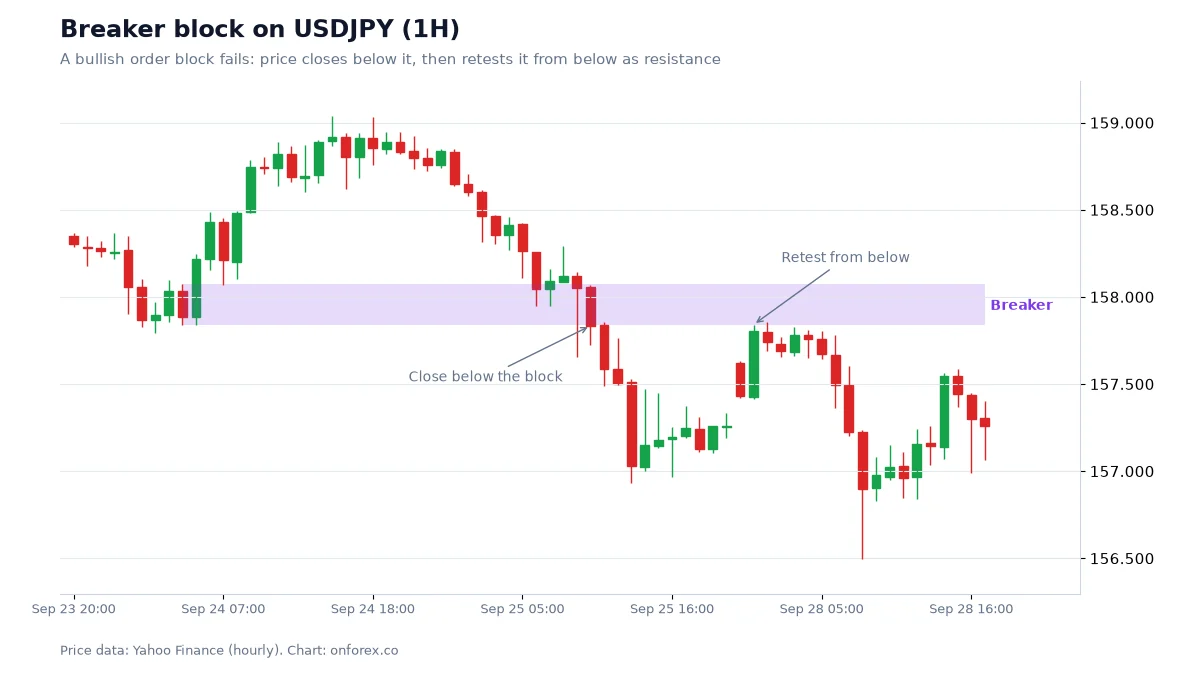
The chart shows exactly that: a bullish order block, a close below it, a retest from below, and a move down. It is one example that fits the description well. Many failed blocks are not retested at all, and some retests fail too.
Breaker vs mitigation block vs order block
These words are used loosely, and different teachers define them slightly differently. Here is a clear way to keep them apart.
| Order block | Breaker block | Mitigation block | |
|---|---|---|---|
| Status | Not yet broken | Broken (close through), now flipped | Broken zone from a move that did not take liquidity first |
| Watched as | Support (bullish) or resistance (bearish) | Resistance (failed bullish) or support (failed bearish) | Same flip logic as a breaker |
| Typical story | Orders are still waiting at the zone | Trapped traders may exit at their entry price | Often described as a weaker reaction because liquidity was not swept (we have not measured this) |
The difference between breaker and mitigation block depends on whether a liquidity sweep took place before the structure shifted: a sweep is when price wicks beyond a swing high or low, taking out the orders resting there, and closes back inside. If you cannot agree with yourself on which label applies, it does not matter much for the trade. What matters is that you define the rule and keep it.
How to mark a breaker
- Mark the original order block and its high and low.
- Wait for a close through the far side. A wick through is not a failure.
- Check that structure shifted, meaning price also closed beyond a nearby swing in the new direction.
- Extend the zone to the right and wait for a retest.
- Look at where the zone sits in the current range. A bearish breaker in the premium half of the range lines up better than one in discount; see premium and discount.
- Define the stop. Put it beyond the far edge of the breaker with a buffer; we use 0.2 x ATR(14), where ATR is the average candle range over 14 bars.
An illustrative plan
These numbers are made up to show the arithmetic. Say USDJPY failed a bullish block between 149.80 and 149.60, then rallied back to 149.75. A short idea there might put the stop at 150.00 (25 pips from the entry at 149.75) and a target at 149.25 (50 pips, so 2R).
With a USD 1,000 account risking 1% (USD 10), the position is worth roughly USD 10 / (25 pips x about USD 6.7 per pip per standard lot at this level) = 0.06 lots. Pip value on yen pairs depends on the current rate, so check it with your platform or our pip value guide before sizing.
Risks and common mistakes
- Calling every failed zone a breaker. Price breaks levels all day. A breaker needs a clear order block and a structural shift.
- Entering at the first touch with no stop beyond the zone. Failed zones are often retested twice, and stops placed at the edge get run. Wicks and slippage are normal at the open and around news, and a spread of a few pips can decide a small stop.
- Forgetting that the block already failed once. The first sign that a zone does not work is the reason it is now a breaker. There is no reason it must work in the new direction.
- Fighting the larger trend. A bearish breaker in a strong daily uptrend has less going for it.
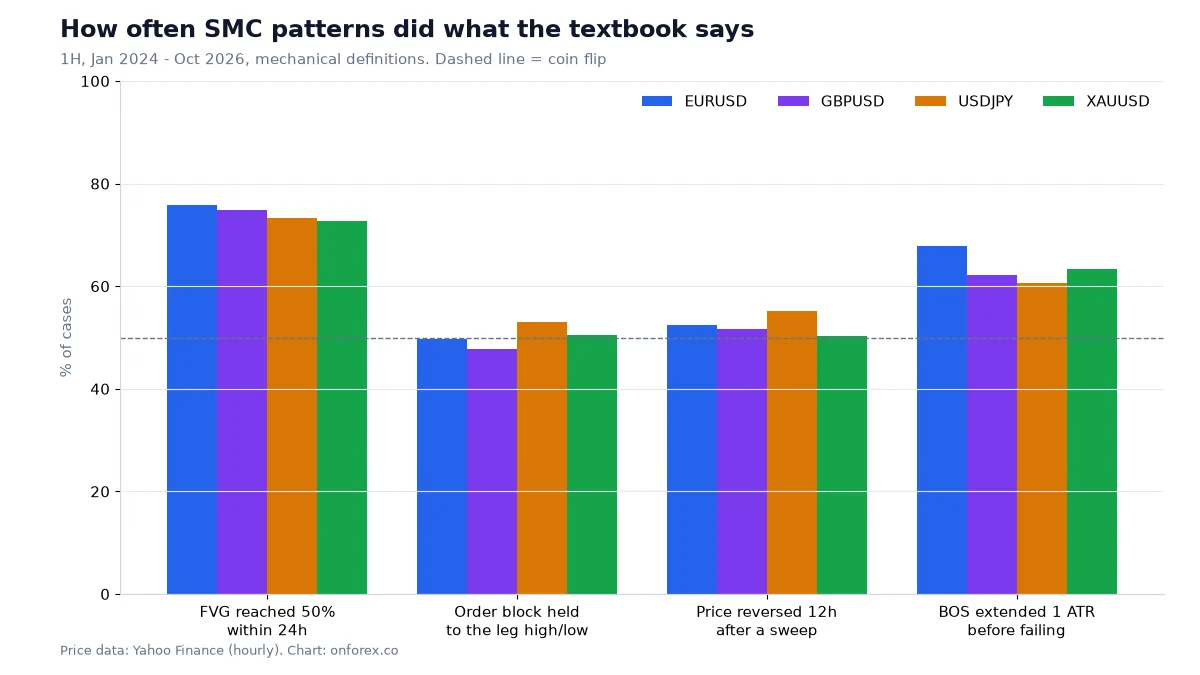
- Not testing. Our data on order blocks, where about 48% to 53% held after a touch, tells us failure is normal. A fair share of the failures are the raw material for breakers, but we have no figure for how often the flipped zone works. Collect your own: 30 to 50 examples recorded in R.
Our data in context
Source: OnForex analysis of hourly prices from Yahoo Finance, January 2024 - October 2026 (gold: June 2024 - October 2026, COMEX gold futures). In the order block study, after price touched the block, it held until the leg's high or low was revisited in 49.7% of cases on EURUSD, 47.7% on GBPUSD, 53.1% on USDJPY and 50.4% on gold. The rest closed through the block. Those closes through are the starting point for breakers, but we did not test what happened after, so we make no claim about breaker success. Treat any win rate you read elsewhere for breakers with caution unless the author shows the method.
Putting it together
A calm way to use the idea: map structure first, mark order blocks only after a break, note which ones fail, and watch the failed ones as areas for a possible retest, alongside fair value gaps and liquidity. Then use a fixed risk per trade, see risk per trade and stop loss, and keep a journal. See also Smart Money Concepts and price action.
Practise on a demo account first
Mark structure, FVGs and stops on a free Exness demo account before you risk money. Forex and CFD trading carries a high risk of loss.
Continue to ExnessForex and CFD trading involves significant risk. You may lose your invested capital.
Risk warning: Forex and CFD trading carries a high risk of loss and is not suitable for everyone. You can lose more than you deposit in some cases. Past patterns, including those in this article, do not predict future results. Nothing here is investment advice.
Related Articles

Order Block: How to Mark It, Trade It and Test It
Order block explained: bullish and bearish OB, how to mark one step by step, mitigation, valid vs weak blocks, and how often OBs held in our own price data.

Smart Money Concepts (SMC) Explained: ICT Basics and Our Data
Smart money concepts (SMC) explained: what ICT terms like BOS, order block and FVG mean, how a top-down read works, and what our own price data shows.

Supply and Demand Zones: How to Draw, Trade and Test Them
Supply and demand zones explained: base and departure, how to draw a zone step by step, fresh vs tested zones, and how often zones held in our own 4H data.

Divergence in Forex: Regular and Hidden RSI/MACD Guide
Divergence explained: regular and hidden RSI and MACD divergence, how to spot it, why it fails, and what 965 cases in our own price data showed.

Pin Bar: How to Spot, Trade and Test a Pin Bar Candle
Pin bar explained: bullish and bearish pin bar rules, where they matter, a worked trade with stop and sizing, plus how pin bars performed in our 4-market data.

Engulfing Pattern: How to Read and Test Engulfing Candles
Engulfing pattern explained: bullish and bearish engulfing rules, context, a worked example with stop and sizing, and how it performed in our 4-market data.