Engulfing Pattern: How to Read and Test Engulfing Candles
Engulfing pattern explained: bullish and bearish engulfing rules, context, a worked example with stop and sizing, and how it performed in our 4-market data.
This site contains affiliate links. We may earn a commission if you sign up through our links. How we research
An engulfing pattern is a two-candle formation where the real body of the second candle completely covers the body of the first candle and has the opposite colour: a green body that covers a red one after a decline is a bullish engulfing candle, and a red body that covers a green one after a rise is a bearish engulfing candle. Traders read it as one side taking control within a single candle. In our hourly and 4-hour data on four markets, engulfing candles alone landed within a few points of coin-flip results, so treat the pattern as a prompt to look at context, not as a signal.
Disclosure: OnForex may earn a referral commission from Exness links on this page. This is general education, not investment advice.
This guide covers the exact rules for bullish and bearish engulfing candles, the context that makes one worth a second look, a worked example with a stop and position size, and the results of our own test across EURUSD, GBPUSD, USDJPY and gold.
What is an engulfing candle?
A candle has a real body (the distance between its open and close) and wicks (the thin lines showing the high and low). The engulfing pattern compares the bodies of two neighbouring candles.
Bullish engulfing needs three things:
- A preceding decline, so the first candle is usually red (a down candle).
- A second candle that is green (an up candle).
- The green body opens at or below the previous close and closes at or above the previous open, so it covers the whole red body.
Bearish engulfing is the mirror image: a rise, a red second candle, and a body that opens at or above the previous close and closes at or below the previous open.
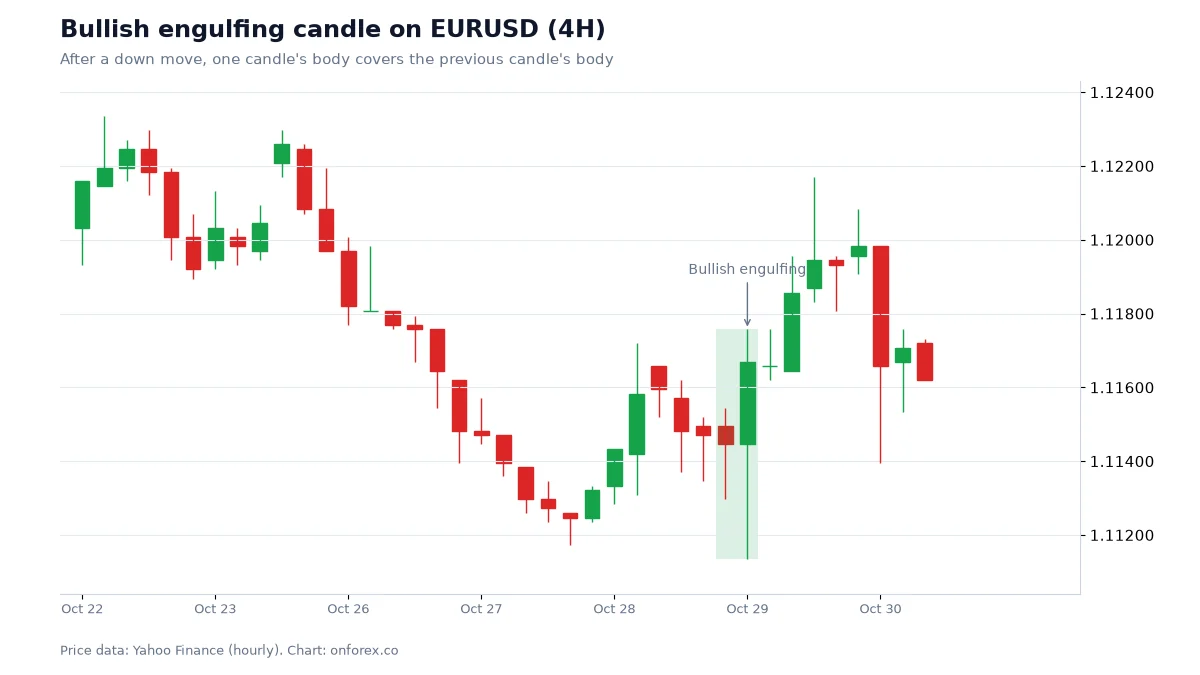
On the chart, the highlighted candle opens near the close of the red candle before it and closes well above that candle's open. That is all the pattern says. It does not tell you that the decline is finished.
Loose and strict versions
Because there is no official definition, traders use slightly different rules. The two most common are:
| Version | Rule | Effect |
|---|---|---|
| Body engulfing (common) | Second body covers first body | More patterns, includes small first candles |
| Range engulfing (strict) | Second candle's high-low range covers the first candle's range | Fewer patterns, stronger look |
Whichever version you choose, write it down. If you change the rule after you see the result, the test means nothing.
Why traders watch engulfing candles
The usual explanation is simple. After a decline, sellers push price down. A candle that opens lower but closes above the previous open means buyers absorbed all that selling and more within the candle. The story is a shift in control from sellers to buyers.
That story is a way to describe what happened, not a proof that it will continue. Candles are summaries of price: four numbers (open, high, low, close) for a period. An engulfing body can form because of a news release, a thin market at the open, or a stop run. The same shape can have very different causes, which is why context matters more than the shape.
Context that separates a useful engulfing candle from noise
Traders who use this pattern usually ask four questions before paying attention to it.
1. Where did it form?
A bullish engulfing candle in the middle of nowhere is just a green candle. One that forms at a place where buyers were expected, such as a prior swing low, a support and resistance zone, the discount half of a range (premium and discount) or an order block, has a reason to be on your chart.
2. Did it follow a liquidity sweep?
Sometimes the first candle pushes below an obvious low, takes the stops there, and the next candle closes back above. That sequence is a liquidity sweep, and an engulfing candle is one way to see the recovery. It is a stronger story than a plain green candle, though we did not test it separately.
3. How big is the candle?
A tiny engulfing candle that covers a tiny body tells you very little. We required the candle range to be at least 0.5 ATR (the average true range of the last 14 candles, see ATR). A candle that is large relative to recent volatility at least shows that something happened.
4. What is the larger trend?
A bullish engulfing candle against a strong downtrend on a higher time frame is a counter-trend idea. It can work, but the stop is more likely to be hit. Check the higher time frame first (multi-timeframe analysis) and read the market structure.
How people trade an engulfing candle
There is no single method. This is the common skeleton, written as a plan you can test, not as a recommendation.
- Mark the pattern at the close of the second candle. Do not act in the middle of the candle: the body is not final until it closes.
- Choose an entry. Options are the close of the engulfing candle, or a limit order near the 50% level of its body, which gives a smaller stop distance but may never fill.
- Place the stop beyond the pattern. For a bullish pattern, below the low of the engulfing candle (or the pair's low) plus a buffer so a small spike does not take you out. A buffer of 0.2 ATR is a common choice.
- Set the target in R. Decide the reward as a multiple of your risk before entering. Our risk-reward ratio guide shows what win rate each ratio needs.
- Size the position from the stop, not from a feeling (position sizing).
A worked example with numbers
The numbers below are read approximately from the EURUSD chart above and are for illustration only.
- Engulfing candle close (entry): about 1.1167.
- Low of the engulfing candle (wick): about 1.1113.
- Stop: 3 pips below that low, at about 1.1110. Distance: about 57 pips.
- Account: USD 5,000. Risk per trade: 1% = USD 50.
- Pip value on EURUSD: about USD 10 per pip for one standard lot.
- Position size: 50 / (57 pips x USD 10) = 0.088 lots, rounded down to 0.08 lots.
- Target at 2R: 114 pips above entry, about 1.1281.
Notice two things. First, the stop is wide because the engulfing candle had a long lower wick; this is common and is why many traders use the 4-hour chart with a small position instead of a large one. Second, the spread widens around news and at the open, and a stop is executed as a market order, so a fill can be a little worse than the level you set (slippage).
On this chart, price did bounce after the pattern, reaching about 50 pips above entry at the highest wick within a few candles, but it never came close to the 2R target at about 1.1281, and a large red candle followed. The trade would have ended at the stop or as a small result depending on how it was managed. This is one example, not evidence. The point of the example is the process: define the stop first, derive the size from it, and accept that any single trade can lose.
Our data: how did engulfing candles perform?
We tested engulfing candles on four markets using hourly prices from Yahoo Finance, January 2024 to October 2026 (gold: June 2024 to October 2026, COMEX gold futures), with 4-hour candles built from the hourly data. This is the OnForex analysis of those prices.
Definitions. A candle counts when its range is at least 0.5 ATR(14). Bullish engulfing: after a decline (the previous candle is red and the close is below the close three candles earlier), a green body that opens at or below the previous close and closes at or above the previous open. Bearish engulfing is the mirror. The outcome is the direction of price 6 candles (24 hours) after the pattern candle. The baseline is the share of all 4-hour candles after which price was higher (or lower) 6 candles later.
| 4-hour, 24 hours later | EURUSD | GBPUSD | USDJPY | XAUUSD |
|---|---|---|---|---|
| Bullish engulfing: price higher (cases) | 48.2% (220) | 48.6% (177) | 62.6% (190) | 53.2% (141) |
| Baseline: price higher | 47.6% | 51.4% | 55.9% | 54.0% |
| Bearish engulfing: price lower (cases) | 52.2% (250) | 53.4% (176) | 44.8% (165) | 48.7% (158) |
| Baseline: price lower | 52.4% | 48.6% | 44.1% | 46.0% |
On 1-hour candles the picture was similar: bullish engulfing was followed by a higher price 46.8% (746 cases), 49.3% (582), 53.1% (807) and 51.9% (616) of the time, against baselines of 48.5%, 50.5%, 53.2% and 52.9%.
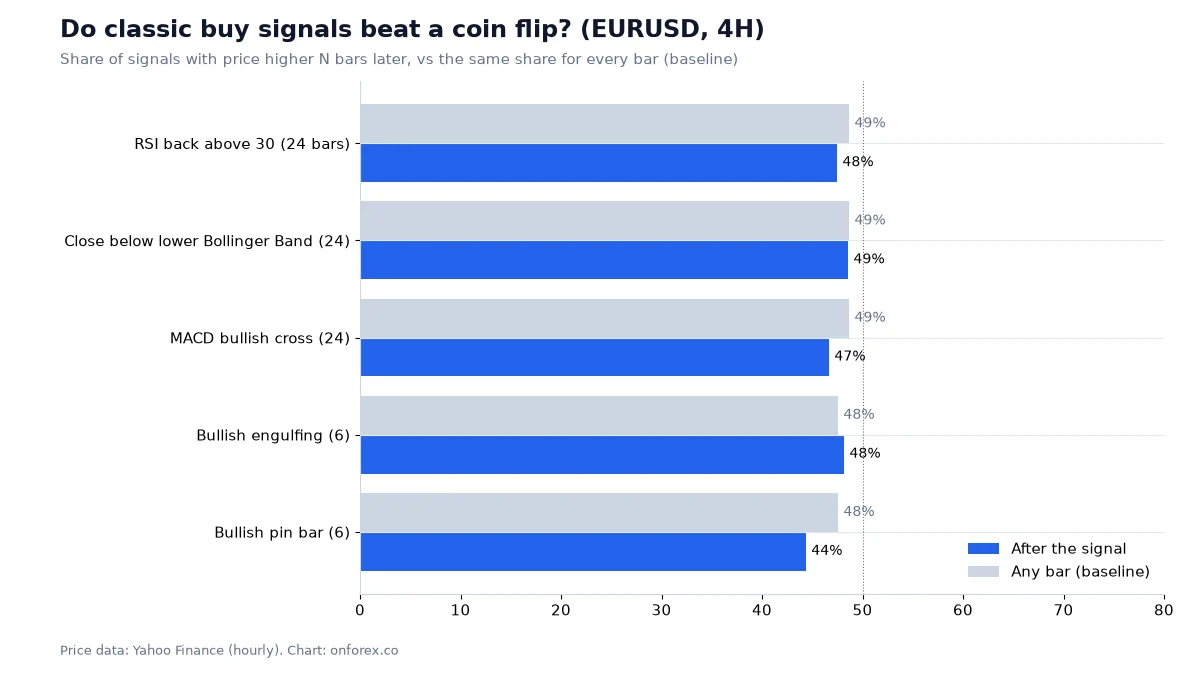
How to read the table
- Most cells are within a few points of the baseline. The baseline matters because USDJPY and gold rose over the period, so "price higher 24 hours later" was more than 50% for any entry, including a random one.
- The one big gap is USDJPY bullish engulfing (62.6% against 55.9%). With 190 cases, a gap of about 7 points is about the size of normal sampling noise (roughly plus or minus 7 points at 95% confidence for this number of cases), and one market out of four moving is not strong evidence.
- We did not test context. The numbers describe the bare pattern. If a trader only takes engulfing candles at a sweep of a prior low in a rising higher time frame, that is a different test. We have not run it, so we do not claim it works or does not.
The honest summary: the bare engulfing pattern gave us no measurable edge on these markets and period. That does not mean no discretionary trader can use it well, but it means you should not trust it without your own testing (backtesting guide).
Common mistakes
- Trading every engulfing candle. The shape appears all the time. Without a location and a stop plan, it is only a green candle.
- Entering inside the candle. A candle that looks engulfing at 11:30 can end as a small body at 12:00. Wait for the close.
- Ignoring the stop distance. A big engulfing candle means a wide stop. If the size that fits your risk is too small to trade, skip it.
- Choosing the rule after the fact. Redrawing the pattern to fit what happened is the most common error in screenshots you see online.
- Expecting a reversal every time. Engulfing candles also appear inside continuing trends as short pauses.
- Forgetting costs. On a 1-hour chart a few pips of spread are a visible part of a 20-pip stop; compare spreads at different times (spread explained).
Engulfing candles and related patterns
| Pattern | What it shows | Page |
|---|---|---|
| Engulfing | Body covers the previous body | This page |
| Pin bar | Long wick rejects a level | Pin bar |
| Inside bar | Range contracts inside the previous candle | Inside bar |
| Candle overview | Many named patterns | Candlestick patterns |
For the larger picture of reading price without indicators, see price action.
How to practise
Choose one definition, one time frame and one market. Scroll back through at least 50 past examples and record the result of each in R: entry, stop and whether the target or the stop came first. Count how often the plan wins and what the average R is. Only then try it forward on a demo account. If the numbers do not beat doing nothing, change the context rule, not the story.
Practise on a demo account first
Mark structure, FVGs and stops on a free Exness demo account before you risk money. Forex and CFD trading carries a high risk of loss.
Continue to ExnessForex and CFD trading involves significant risk. You may lose your invested capital.
Risk warning: Forex and CFD trading carries a high risk of loss and is not suitable for everyone. You can lose more than your deposit in some cases. Past price behaviour, including the results in this article, does not predict future results. This page is general education and not investment advice.
Related Articles
Pin Bar: How to Spot, Trade and Test a Pin Bar Candle
Pin bar explained: bullish and bearish pin bar rules, where they matter, a worked trade with stop and sizing, plus how pin bars performed in our 4-market data.

Order Block: How to Mark It, Trade It and Test It
Order block explained: bullish and bearish OB, how to mark one step by step, mitigation, valid vs weak blocks, and how often OBs held in our own price data.
Divergence in Forex: Regular and Hidden RSI/MACD Guide
Divergence explained: regular and hidden RSI and MACD divergence, how to spot it, why it fails, and what 965 cases in our own price data showed.
Inside Bar Strategy: How to Trade It, With Data on 1,773 Setups
What an inside bar is, how to read the mother bar, three ways to trade the break, and what 1,773 inside bars on EURUSD, GBPUSD, USDJPY and gold showed.
Breaker Block: What It Is and How It Differs From an OB
Breaker block explained: how a failed order block becomes a breaker, breaker vs mitigation block vs order block, how to mark one, and the risks of trading it.
News Trading in Forex: How NFP and CPI Move Price (With Data)
News trading explained: what moves on NFP, CPI and central bank days, how much wider the range gets (EURUSD 39 vs 15 pips), and ways to manage spread and slippage.