News Trading in Forex: How NFP and CPI Move Price (With Data)
News trading explained: what moves on NFP, CPI and central bank days, how much wider the range gets (EURUSD 39 vs 15 pips), and ways to manage spread and slippage.
This site contains affiliate links. We may earn a commission if you sign up through our links. How we research
News trading is the practice of trading around scheduled economic releases and central bank events, such as US nonfarm payrolls (NFP), consumer price inflation (CPI) and interest rate decisions, when price often moves several times its normal range in minutes. The opportunity is movement; the cost is wider spreads, slippage and fast reversals. This guide covers which events matter, how to read a release, what our own data says about how big the moves are, and the common ways traders handle them.
Disclosure: OnForex may earn a referral commission from Exness links on this page. This is general education, not investment advice.
Which news events move forex
Not every headline matters. The ones that repeatedly move the market are scheduled, have a known time, and relate to interest-rate expectations, which are the main driver of currency values.
| Event | What it measures | Typical timing |
|---|---|---|
| US nonfarm payrolls (NFP) | Jobs added in the previous month, plus unemployment rate | 8:30 New York, usually the first Friday of the month |
| Consumer price index (CPI) | Change in consumer prices (inflation) | Monthly, 8:30 New York for the US |
| FOMC rate decision and press conference | US Federal Reserve policy rate and guidance | Eight scheduled meetings a year; statement and press conference follow in the afternoon, New York time |
| Other central banks (ECB, Bank of England, Bank of Japan) | Policy rates and guidance for euro, pound, yen | Each bank publishes its own calendar |
| GDP, retail sales, PMI | Growth, spending, business surveys | Varies by country |
| ISM and JOLTS | US surveys and job openings | Some are released at 10:00 New York |
The US releases dominate because the US dollar is on one side of most major pairs and gold is priced in dollars. The payrolls report, published by the US Bureau of Labor Statistics (see its release schedule), is the best-known example.
To plan around these events, use an economic calendar and mark the impact level, the time in your time zone and the three numbers every release has.
Actual, forecast and previous
Each release has an actual value, a forecast (the consensus of economists' estimates) and a previous value. Markets move on the surprise, meaning the difference between actual and forecast, not on whether the number is good in absolute terms. A strong jobs figure that is below forecast can push the dollar lower; a weak figure that beats a gloomy forecast can lift it.
Two further points:
- Revisions matter. The previous figure is often revised, and the headline number can conflict with the revision. Algorithms react to several lines at once, which is one reason the first move can reverse within minutes.
- Expectations are priced in. The saying "buy the rumour, sell the fact" describes price rising before an event and falling when the news is confirmed. It is a description of crowd positioning, not a rule.
How big are the moves? Our data
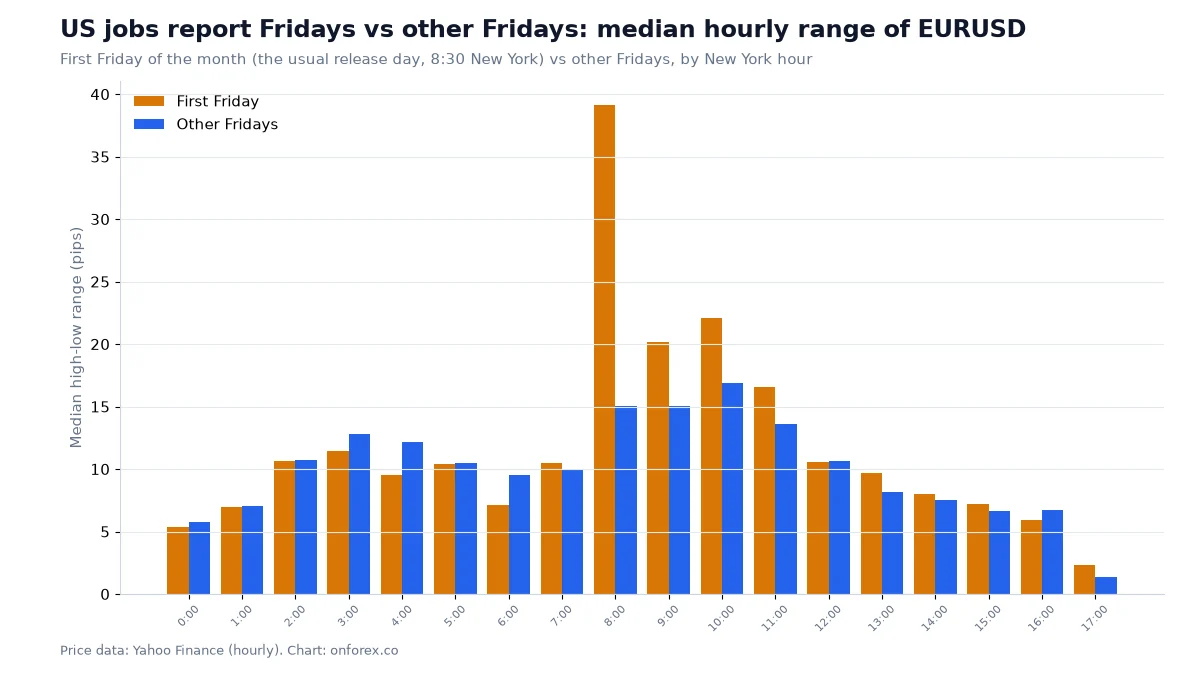
We measured the effect on the hourly bar that contains the US payrolls release. In the OnForex analysis of hourly prices from Yahoo Finance, January 2024 - October 2026 (gold: June 2024 - October 2026, COMEX gold futures), we compared the median range of the 8:00-9:00 New York bar on first Fridays of the month with other Fridays. There were 33 first Fridays (26 for gold). We did not correct for releases that were moved to another date, so the first-Friday group is an approximation.
| EURUSD | GBPUSD | USDJPY | XAUUSD | |
|---|---|---|---|---|
| Median range, first Fridays | 39.1 pips | 40.2 pips | 66.7 pips | USD 28.6 |
| Median range, other Fridays | 15.0 pips | 19.2 pips | 28.5 pips | USD 16.4 |
| 90th percentile, first Fridays | 72.5 pips | 80.1 pips | 197.9 pips | USD 70.1 |
Three things stand out:
- The median hour is roughly 2 to 2.6 times larger than the same hour on other Fridays. On EURUSD that is 39.1 vs 15.0 pips.
- The tail is the real risk. The 90th percentile is much larger than the median: 72.5 pips on EURUSD and 197.9 pips on USDJPY. One release in ten moved the hour by that much or more.
- The effect is concentrated around the release. For comparison with regular session activity, see the ICT kill zones and trading hours pages, where the busiest regular hours of EURUSD average 17-18.6 pips, well below a payrolls hour.
These are ranges, not directions. A bigger range does not mean a tradable direction, and the same move can hit a buy stop and then a sell stop in sequence.
What happens to spreads and execution
Large ranges come with trading costs that are easy to underestimate.
- Spreads widen. Liquidity providers pull back around a release, so quoted spreads can be far above the normal level for seconds to minutes.
- Slippage on stops. A stop loss turns into a market order when triggered. If price jumps through it, you are filled at the next available price, which can be worse than the stop. See the slippage guide.
- Requotes and delayed fills. Some execution models reject or delay orders in fast conditions.
- Gaps in the data. There may be no trades between two prices, so the chart on your screen can show a jump rather than a smooth path.
A risk you planned at 1% can therefore turn into more than 1% on a bad fill. For the basics of stops see the stop loss guide, and for the pip and cost side of the trade see the spread guide.
Four ways traders handle news
1. Stay flat
Close or avoid positions before the release and return when spreads normalise. It is the simplest choice and, for many traders, the most sensible. If you already have an open trade, decide before the release whether the stop is placed outside the expected range, or whether to close, partly close or move the stop.
2. Reduce size and widen the stop
If you keep a position, risk less. A normal day might use a 20-pip stop. If the payrolls hour has a median range near 39 pips, a 20-pip stop sits inside the noise and will probably be hit, even if your view is right. Using a wider stop with a much smaller position keeps the money at risk the same. Illustrative numbers: risking USD 10 with a 20-pip stop on EURUSD is 0.05 lots (10 / (20 x 10)). A 60-pip stop with the same USD 10 risk is about 0.017 lots.
3. Trade the reaction, not the release
Many traders wait 15 to 30 minutes, let the first spike settle, and use normal tools: market structure, support and resistance and a defined stop. The first move is often a liquidity sweep in either direction before a clearer move develops. The cost is that part of the move has already happened.
4. Straddle orders
A straddle places a buy stop above and a sell stop below the price just before the release, hoping that one side runs. The weakness is the one our data shows: when the median range is 39 pips, price can trigger both orders in turn and lose on each. Add widened spreads and slippage on both fills, and the plan can lose before the real move starts. We include it because people ask about it, not because we recommend it.
A simple plan for the day
- Find the event on the calendar the day before. Note the time in your time zone: 8:30 New York is 21:30 in Japan during US summer time and 22:30 in winter.
- Decide the rule in advance. Flat, reduced size, or wait for the reaction. Write it down.
- Check open trades. Is the stop inside the expected range? Is the position size right for a wider stop?
- After the release, wait for spreads to settle and for the first swing to form. Treat entries as ordinary trades and risk a normal or reduced amount.
- Review the result in a trade log, including the actual spread and fill price, not only the chart.
Common mistakes
- Using the same stop and size as on a quiet day. The range is two to three times larger.
- Trading a straddle with tight stops. Both sides can be hit.
- Assuming a good number means the currency rises. Only the surprise relative to forecast matters, and the first move may reverse.
- Ignoring other events in the same hour. A speech or a second release can follow the headline.
- Holding through a release by accident. Check the calendar before you leave a trade overnight or over a weekend.
- Chasing the spike. Entering after a 40-pip candle often buys the top of a short move. Use risk management rules instead of emotion; see also psychology.
- Skipping the demo stage. Watch five or six releases on a demo account before you risk real money. The gold trading guide shows how gold behaves in the same hours.
Related guides
For the data behind the quiet and busy hours see ICT kill zones. For sizing around volatile moments read position sizing and risk per trade. Short-term traders may also want scalping strategy and day trading. For the order types used around releases, see order types.
Practise on a demo account first
Watch a release on a free Exness demo account and log the spread and fill before you risk money. Forex and CFD trading carries a high risk of loss.
Continue to ExnessForex and CFD trading involves significant risk. You may lose your invested capital.
Risk warning: Forex and CFD trading carries a high risk of loss and is not suitable for everyone. Economic releases can cause very large moves, wide spreads, gaps and slippage, and stop losses may fill at worse prices than planned. Past price behaviour does not predict future results. Never risk money you cannot afford to lose.
Related Articles
How to Use the Economic Calendar for Forex Trading
Learn how to read and trade the economic calendar: NFP, CPI, FOMC, and other key events that move forex markets, with strategies for trading news releases.
Breakout Trading Strategy: How to Trade Forex Breakouts
Master forex breakout trading in 2026. Learn how to identify real breakouts, filter false breaks with volume, and apply precise entry and exit rules to capture big moves.

Ichimoku Cloud Explained: Five Lines, Signals and Settings
Ichimoku cloud explained: the five lines, how to read the cloud, sanyaku kōten and gyakuten, the 9-26-52 settings and what our daily data shows.

ICT Silver Bullet: Times, Rules and What Our Data Shows
The ICT silver bullet strategy: the 10-11 am New York window, the sweep-and-FVG entry, time zone conversions, and our data on what that hour does.

How to Backtest a Trading Strategy (Forex Backtesting Guide)
Forex backtesting step by step: manual and automated methods, the metrics that matter, sample size, costs, and our EMA crossover test that shows overfitting.

Pin Bar: How to Spot, Trade and Test a Pin Bar Candle
Pin bar explained: bullish and bearish pin bar rules, where they matter, a worked trade with stop and sizing, plus how pin bars performed in our 4-market data.