Ichimoku Cloud Explained: Five Lines, Signals and Settings
Ichimoku cloud explained: the five lines, how to read the cloud, sanyaku kōten and gyakuten, the 9-26-52 settings and what our daily data shows.
This site contains affiliate links. We may earn a commission if you sign up through our links. How we research
Ichimoku Kinko Hyo, usually called the Ichimoku cloud, is a charting system made of five lines. Two of them, Senkou Span A and B, form a shaded band called the cloud (kumo) that is plotted ahead of price. Together the lines show the trend direction, likely support and resistance, and momentum on one chart, using the default periods 9, 26 and 52.
Disclosure: OnForex may earn a referral commission from Exness links on this page. This is general education, not investment advice.
Ichimoku looks busy at first, but each line is just a midpoint of a recent high-low range or a shifted copy of price. This page explains every line, how to read the cloud, what the three-signal setup (sanyaku kōten and sanyaku gyakuten) means, and what our own daily-chart data says about how much the cloud adds. It sits next to moving averages and market structure as a way to describe the trend.
Where Ichimoku comes from
Ichimoku Kinko Hyo, roughly "one-glance equilibrium chart", was developed by the Japanese journalist Goichi Hosoda, who wrote under the pen name Ichimoku Sanjin, and published in the late 1960s after years of work. A short overview is on Wikipedia. The default numbers are usually explained as reflecting the Japanese market's six-day trading week of the time: 9 is about a week and a half, 26 about a month, 52 about two months. Whatever the origin, the numbers are conventions, and they work as a shared standard because most traders and platforms use the same ones.
The five lines
Every Ichimoku line is built from two ideas: the midpoint of the highest high and lowest low over N periods, and a shift in time.
| Line | Formula | Default | Reads as |
|---|---|---|---|
| Tenkan-sen (conversion line) | (highest high + lowest low) / 2 over 9 periods | 9 | Short-term balance, fast line |
| Kijun-sen (base line) | (highest high + lowest low) / 2 over 26 periods | 26 | Medium-term balance, slow line, often used as a trailing level |
| Senkou Span A (leading span A) | (Tenkan + Kijun) / 2, plotted 26 periods ahead | 26 shift | First cloud edge |
| Senkou Span B (leading span B) | (highest high + lowest low) / 2 over 52 periods, plotted 26 periods ahead | 52 / 26 shift | Second cloud edge, slower |
| Chikou Span (lagging span) | Current close, plotted 26 periods back | 26 shift | Today's price against the price of 26 periods ago |
The region between Span A and Span B is the cloud. A bullish cloud is when Span A is above Span B, and a bearish cloud is the reverse. The cloud is plotted 26 periods into the future, so at any moment you can see where the cloud will be before price gets there. This forward plot is the trick that makes it feel like a forecast, but it is simply the average of past data moved forward.
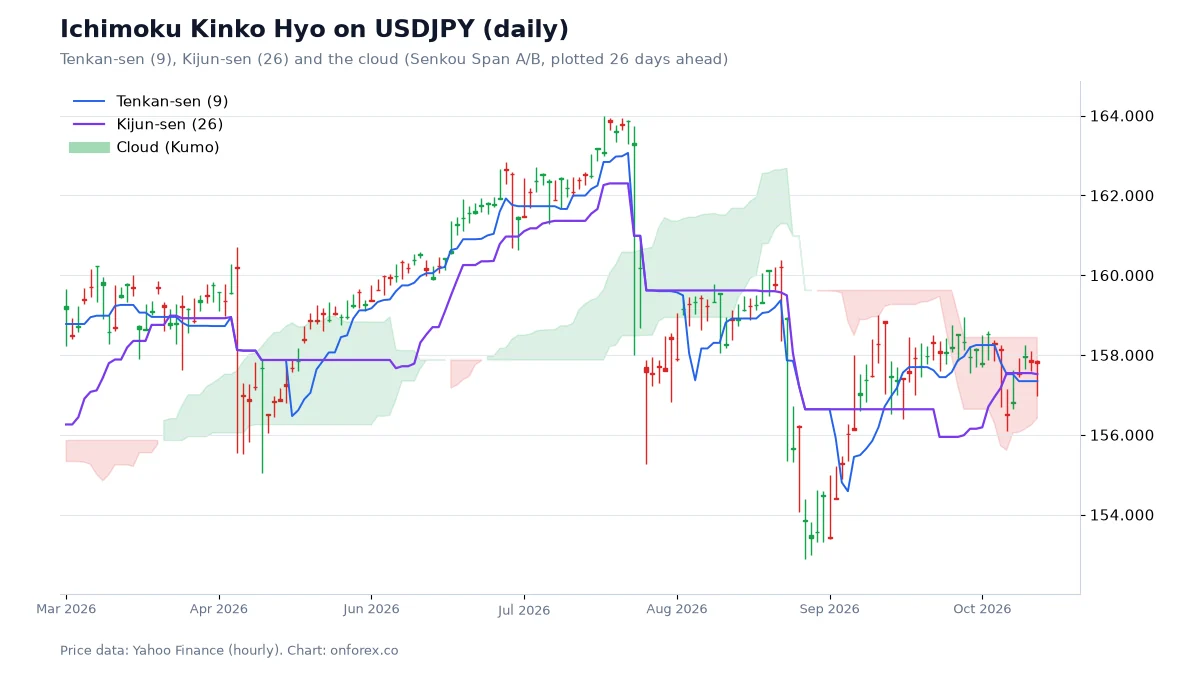
On the chart, price trades above a rising cloud for most of the period, with Tenkan-sen above Kijun-sen. A pullback reaches back toward the Kijun-sen, and the upper edge of the cloud is a possible area of support. Notice the cloud's thickness: a thick cloud is a wider zone that price has to cross, and a thin cloud is easily crossed.
How to read the cloud
Price relative to the cloud gives a first-pass trend call.
- Price above the cloud: an uptrend by Ichimoku's definition. The cloud's upper edge is the first area to watch for support.
- Price below the cloud: a downtrend. The cloud's lower edge is the first area to watch for resistance.
- Price inside the cloud: no clear trend. Traders treat this as a range or a transition.
- Cloud colour or twist: when Span A crosses Span B, the cloud twists. It is an early sign of changing balance, not an entry on its own.
- Cloud thickness: a thick cloud means a large gap between the two spans and a wider area to break; a thin cloud means little barrier.
None of these says what price will do next. They describe where price is in relation to its own recent averages.
Tenkan and Kijun
The two midpoint lines do the work that moving-average crosses do elsewhere.
- Tenkan above Kijun: short-term momentum is stronger than the medium-term balance. A bullish TK cross is Tenkan crossing up through Kijun.
- Tenkan below Kijun: the opposite.
- Flat Kijun: when the Kijun-sen is flat, price has often been in a range; price tends to be pulled back toward it, which is why traders use it as an equilibrium reference.
A TK cross that occurs above the cloud is generally treated as a stronger signal than one inside or below it, because it agrees with the larger trend. That rule of thumb is common, not proven; see our data below.
The three-signal setup: sanyaku kōten and gyakuten
Sanyaku kōten (三役好転), often translated "three-signal bullish confirmation", is the situation in which three bullish conditions are true at once:
- Tenkan-sen is above Kijun-sen (a bullish TK cross has happened).
- Price is above the cloud.
- The Chikou Span is above the price of 26 periods earlier (and clear of the candles there).
Sanyaku gyakuten (三役逆転) is the bearish mirror: Tenkan below Kijun, price below the cloud, and the Chikou Span below the price of 26 periods earlier.
When all three align, Ichimoku says momentum, trend and confirmation agree. This is a description of a strong trend, and by the time all three are true the move has usually already run for a while. The honest reading is that the signal reduces false starts at the cost of later entries. We have not back-tested sanyaku kōten itself; the data below only covers the single piece "price above or below the cloud".
Settings: should you change 9-26-52?
The defaults are 9, 26 and 52 on every mainstream platform, including MT4 and MT5. Some forex traders propose longer sets (such as 20-60-120) to suit a market that trades five days a week instead of six. There is no proof that a modified set is better, and a changed set is no longer the shared reference other traders look at. A sensible approach for a beginner is to keep the defaults, use the daily or 4-hour chart, and judge the tool on whether it makes your trend labelling more consistent.
Timeframe matters more than tuning. On 15-minute or 1-hour charts the cloud is thin and quickly crossed, which produces more signals and more false ones. On the daily chart, the cloud is wide and slow to turn, and a signal costs you time to wait for.
What our data shows
We tested one piece of the system on daily data: how often price was above or below the cloud, and how often price was higher 20 trading days later.
| EURUSD | USDJPY | XAUUSD | |
|---|---|---|---|
| Days price was above the cloud | 42.0% | 55.9% | 55.8% |
| Higher 20 days later, after those days | 47.5% | 58.1% | 61.4% |
| Days price was below the cloud | 44.8% | 31.6% | 30.2% |
| Higher 20 days later, after those days | 48.4% | 54.2% | 52.2% |
| Baseline: higher 20 days later on any day | 48.6% | 57.2% | 57.0% |
Source: OnForex analysis of daily prices from Yahoo Finance, October 2016 - October 2026. The remaining days (about 12-14%) were inside the cloud.
Three points stand out. First, on EURUSD price above the cloud was followed by a higher price 47.5% of the time, which is no better than the 48.6% baseline, and below the cloud was 48.4%. The cloud added nothing here. Second, on USDJPY and XAUUSD the cloud mostly mirrored the long uptrend of those markets in the sample (price was above the cloud on about 56% of days). Above the cloud was 0.9 points (gold: 4.4 points) more bullish than the baseline, and below the cloud was 3.0 points (gold: 4.8 points) less bullish, which is a small tilt, and a one-sided sample, since both markets rose over the decade. Third, the cloud mostly reflects the trend that has already happened: it describes, it does not forecast. This is the same honest reading we apply to market structure and other labels.
A worked example with risk attached
Suppose USDJPY trades above a rising cloud on the daily chart with Tenkan above Kijun, as in the chart above. A trader following the cloud reads this as an uptrend and, as one possible rule, looks for a pullback to the Kijun-sen. The invalidation is a daily close below the lower edge of the cloud.
If the entry is at 152.50 and the lower cloud edge plus a buffer is 150.90, the stop distance is 160 pips. Risking 1% of a USD 1,000 account (USD 10) means 10 / (160 x pip value) in lots; with a pip value of roughly USD 6.60 per standard lot at this price, that is 10 / (160 x 6.6) = 0.0095 lots, which is below the 0.01 minimum at most brokers. The point is practical: a daily-cloud stop is wide, so on a small account either the risk percentage rises above your plan or you cannot take the trade. Check the numbers with the pip value and lot size guides before you act on a chart signal. Stops can also fill past the level when spreads widen or price gaps around news.
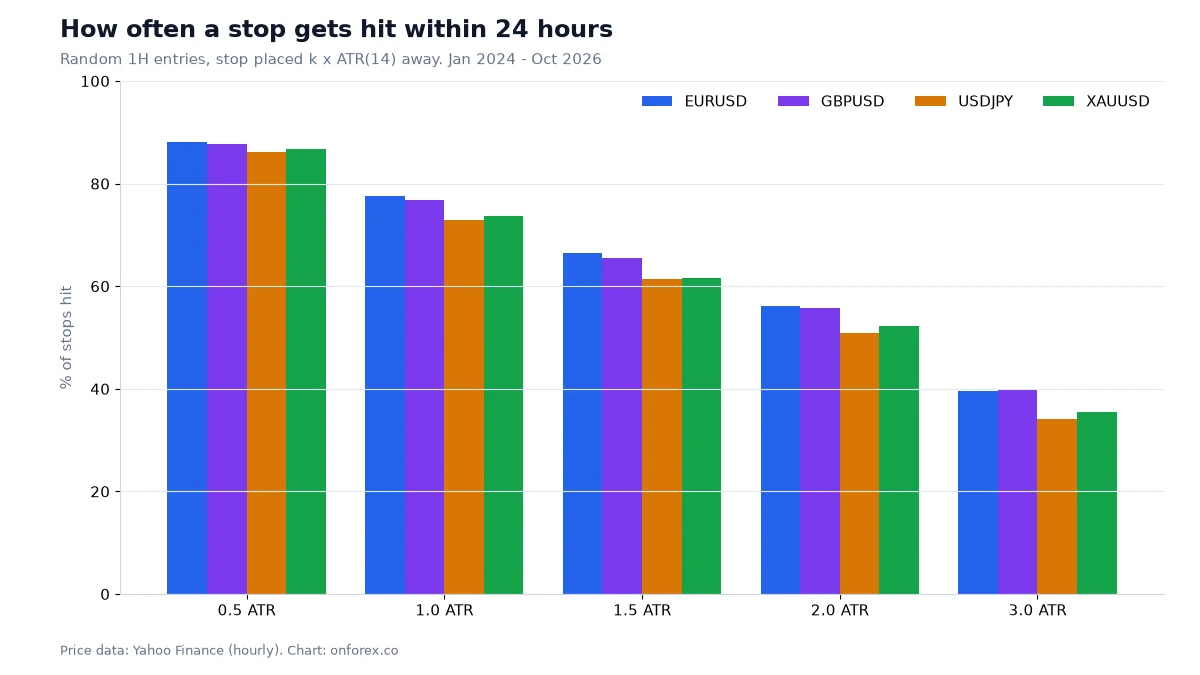
The chart shows why a stop that sits too close to the Kijun or cloud edge is often hit by ordinary noise. On our hourly data a stop 1 ATR away was hit within 24 hours in 73-78% of random entries, and even 3 ATR was hit 34-40% of the time. Use the ATR indicator to scale the stop to the market, and the stop loss guide for placement.
Common mistakes
- Trading every TK cross. Crosses inside the cloud happen often in ranges and rarely lead anywhere.
- Treating the cloud as a forecast. The forward plot is moved past data, not a prediction.
- Using it on very low timeframes. The defaults were built for the daily chart.
- Ignoring the stop distance. A stop beyond the cloud may be far, which affects your lot size.
- Stacking redundant tools. Ichimoku, a moving average and an oscillator may all describe the same trend; that is one piece of evidence, not three.
- Chasing after sanyaku kōten. By the time all three conditions hold, much of the move may be done.
Where to go next
Ichimoku pairs naturally with plain structure: mark the swings first with market structure, then use the cloud and Kijun as a reference. For trend entries see trend trading, and for the level-based side see support and resistance. The MACD guide and RSI guide cover momentum tools you may compare against.
Practise on a demo account first
Add the Ichimoku indicator to a chart on a free Exness demo account and practise reading it before you risk money. Forex and CFD trading carries a high risk of loss.
Continue to ExnessForex and CFD trading involves significant risk. You may lose your invested capital.
Risk warning: Forex and CFD trading carries a high risk of loss, and many retail accounts lose money. Statistics here describe past data under our definitions and do not predict future results. Nothing on this page is investment advice.
Related Articles
Moving Averages in Forex: SMA, EMA, 200-Day Data
Moving averages in forex: SMA vs EMA formulas, 50/200 golden and death crosses, common periods, and what 9 years of daily data show about the 200-day line.
ADX Indicator: Settings, +DI/-DI and What Our Data Shows
ADX indicator guide: how ADX and +DI/-DI are calculated, what 20, 25 and 40 mean, how to use ADX to pick a method, and what our data shows on four markets.
Bollinger Bands: Settings, Squeeze and What the Data Shows
Bollinger Bands explained: the 20/2 formula, %B and bandwidth, the squeeze, walking the bands and a W-bottom, with hit rates from our own hourly forex data.
Parabolic SAR: Settings, Formula and Backtest Results
Parabolic SAR explained: the formula, 0.02 / 0.2 settings, how to read the dots, why it whipsaws, and what a flip-every-signal test showed on four markets.
RSI Indicator: Settings, Strategies and What Our Data Shows
RSI indicator guide: Wilder's formula, the 14 setting, overbought and oversold levels and divergence, with tests on four markets of what RSI can do.

How to Backtest a Trading Strategy (Forex Backtesting Guide)
Forex backtesting step by step: manual and automated methods, the metrics that matter, sample size, costs, and our EMA crossover test that shows overfitting.