How to Backtest a Trading Strategy (Forex Backtesting Guide)
Forex backtesting step by step: manual and automated methods, the metrics that matter, sample size, costs, and our EMA crossover test that shows overfitting.

This site contains affiliate links. We may earn a commission if you sign up through our links. How we research
Backtesting is applying a fixed set of trading rules to past price data and recording every trade those rules would have taken, so you can measure how they behaved before you risk money. A useful backtest has clear rules, includes costs, contains enough trades (100 or more) and is checked on data you did not use to design it. In our own test below, the best of 39 moving average settings made +758 pips on the data used to pick it and only +40 pips on the following year.
Disclosure: OnForex may earn a referral commission from Exness links on this page. This is general education, not investment advice.
This guide covers manual and automated backtesting, the numbers to record, how to avoid the traps that make a backtest look better than reality, and a worked example with our own EURUSD data.
What a backtest can and cannot tell you
A backtest answers one narrow question: if I had followed these exact rules on this data, what would have happened? It is a filter, not a forecast. It is good at killing bad ideas quickly, because a method that loses money on three years of history with costs included is unlikely to start working because you believe in it. It is weak at proving that a good-looking idea will keep working.
| A backtest can show | A backtest cannot show |
|---|---|
| Whether the rules are precise enough to test at all | Future performance |
| Typical win rate, average win and loss in R | How you will feel during a losing streak |
| Rough size of drawdowns and losing streaks | Fills during fast news, gaps and outages |
| How much costs eat into the result | Whether the market regime will stay the same |
Step 1: Write rules a stranger could follow
If two people can read your rules and take different trades, you cannot backtest them. Write down:
- Market and timeframe, for example EURUSD 1H, and the session if it matters (see trading hours).
- Setup conditions, defined objectively. "Strong trend" is not a rule; "4H close above a rising 50 EMA" is. See multi-timeframe analysis for one way to define the higher-timeframe trend.
- Entry trigger: the exact candle and price where you enter.
- Stop-loss: where the idea is wrong, for example below the last swing low plus a small ATR buffer. See stop-loss.
- Exit: fixed target, break-even move, partial take profit or trailing stop. Our trailing stop guide shows how much the exit changes the shape of results.
- Position size: a fixed percentage of equity per trade, so every result can be expressed in R. See risk per trade.
Discretionary methods such as order blocks or supply and demand zones can still be backtested, but you must write checklists tight enough that you would mark the same zone twice.
Step 2: Choose a method
Manual backtesting (bar replay)
Open a chart, move back to a start date, hide the candles to the right and step forward one bar at a time. TradingView's Bar Replay and the visual mode of the MetaTrader Strategy Tester both work this way. When your rules trigger, log the trade before you reveal the next candle.
Strengths: no coding, you learn what the setup really looks like, and you can test judgement-based rules. Weaknesses: it is slow, it is easy to "see" the future by accident, and most people stop after 30 trades.
Automated backtesting (code)
Write the rules as a script: an Expert Advisor in the MT4/MT5 Strategy Tester, a strategy script in TradingView, or Python on downloaded price data. Strengths: thousands of trades in seconds and no hindsight in execution. Weaknesses: you can test hundreds of variations in an afternoon, which is exactly how overfitting happens (see the example below).
Spreadsheet journal
Whichever method you use, record each trade in one row:
| Date/time | Pair | Direction | Entry | Stop | Target | Exit | Result (R) | Notes |
|---|---|---|---|---|---|---|---|---|
| 28 Oct 2026 14:00 | EURUSD | Long | 1.11321 | 1.11247 | 1.11469 | 1.11469 | +2.0 | Bullish OB retest |
That row is our real example from the risk reward ratio guide: a 7.4-pip stop and a 2R target that was reached first. One good trade proves nothing; the point of the log is the next 99.
Step 3: Measure the right numbers
| Metric | Formula / meaning | Why it matters |
|---|---|---|
| Number of trades | Count | Below about 100, the other numbers are unreliable |
| Win rate | Wins / trades | Only meaningful together with the size of wins |
| Average win and average loss (R) | Mean result of winners and losers | Shows the real reward-to-risk you achieved |
| Expectancy | (Win rate x avg win) - (loss rate x avg loss) | Average result per trade in R; must be positive after costs |
| Profit factor | Gross profit / gross loss | Above 1.0 means profitable; thin margins vanish with costs |
| Maximum drawdown | Largest peak-to-trough fall | Tells you what you must be able to sit through |
| Longest losing streak | Count | Sets your risk per trade |
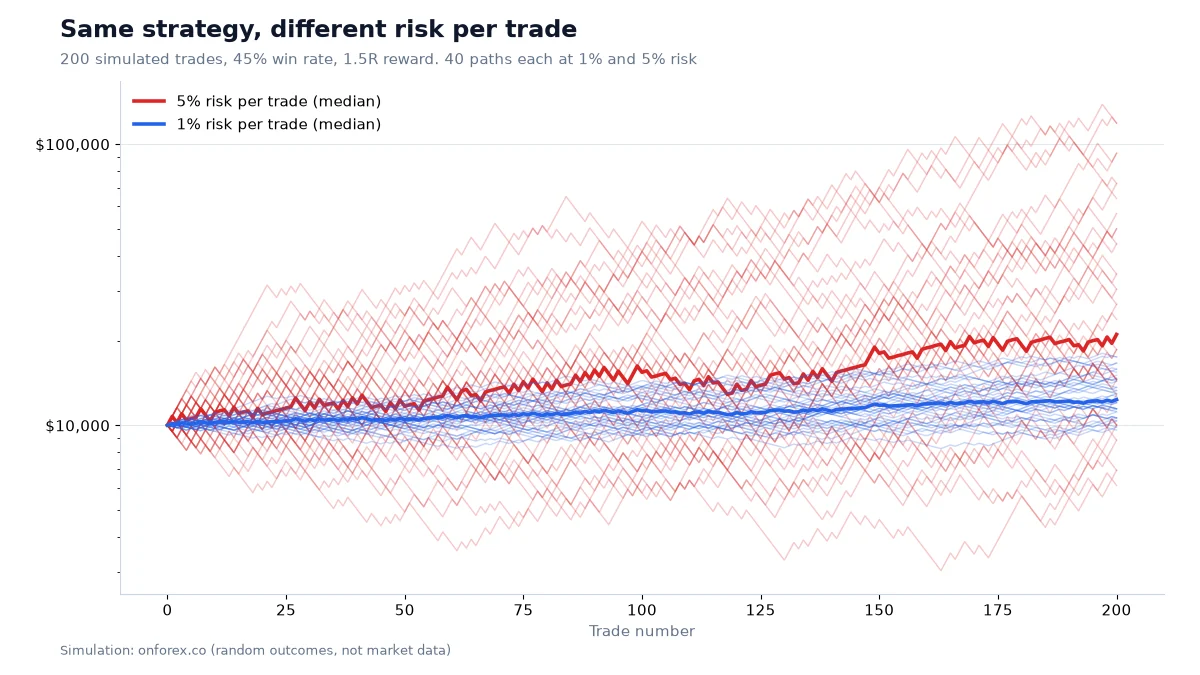
An illustration of expectancy: a method that wins 45% of the time with an average win of 1.5R and an average loss of 1R has an expectancy of 0.45 x 1.5 - 0.55 x 1 = +0.125R per trade. Our Monte Carlo test of exactly that profile (20,000 runs of 200 trades at 1% risk) still produced a median maximum drawdown of 11.7%, a median longest losing streak of 8, and 8.9% of runs finishing below the start. That is the range of luck a real edge can show over 200 trades, so a short backtest can easily land in either tail. See drawdown.
Our example: an EMA crossover on EURUSD 4H
We ran a simple, always-in-the-market system on EURUSD 4H: go long when a fast EMA crosses above a slow EMA, go short on the opposite cross, and switch at the next bar's open. We charged 1.2 pips per round trip for spread. The data were split:
- In-sample: 15 Jan 2024 to 16 Sep 2025 (used to choose the settings).
- Out-of-sample: 16 Sep 2025 to 30 Oct 2026 (not looked at until the end).
We tested 39 combinations (fast 5 to 30, slow 20 to 200). Results in-sample, after costs:
| Result | |
|---|---|
| Combinations tested | 39 |
| Profitable after costs | 14 (36%) |
| Median combination | -158 pips |
| Best combination | EMA 20/200: +758 pips net (+780 gross) on 18 trades |
Then we ran EMA 20/200 unchanged on the out-of-sample period: +40 pips net (+55 gross) on 12 trades, win rate 50%.
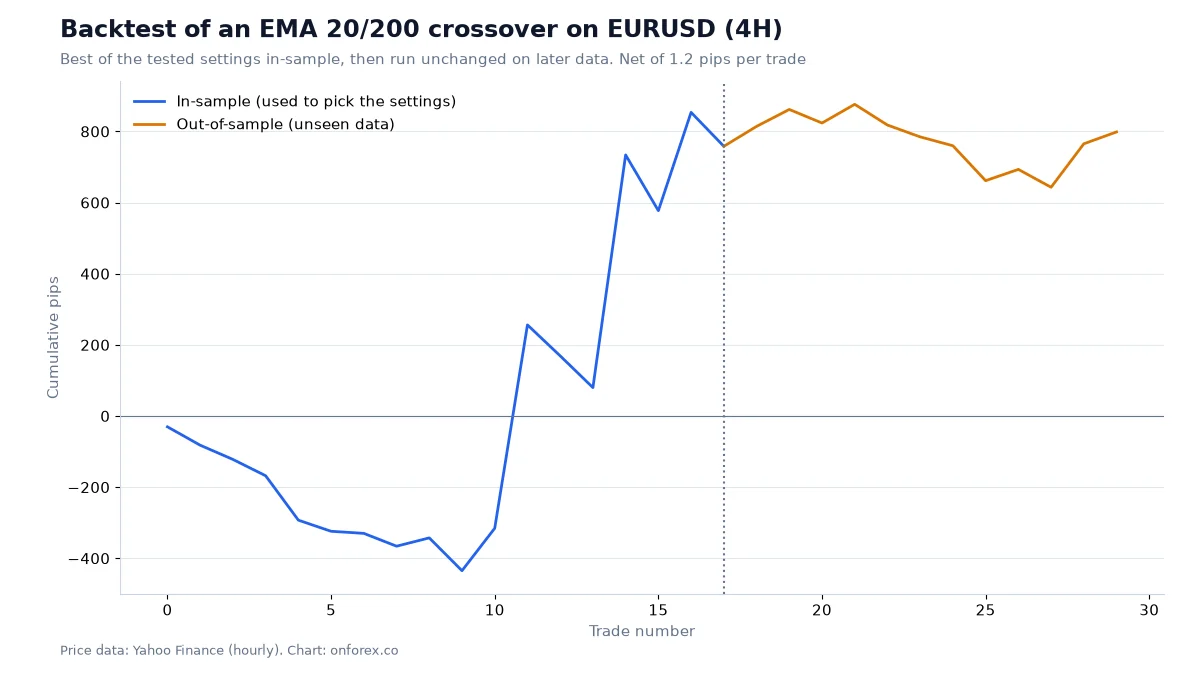
Look at the blue line: the "best" setting was about 400 pips underwater for its first ten trades and most of its gain came from two or three big trend legs. On the amber line it rose, gave back over 200 pips and recovered to finish about 40 pips above where it started. Three lessons follow.
- Choosing the best of many settings inflates results. When most combinations lose and you keep the winner, part of its result is luck that fits this particular stretch of history. This is overfitting, also called curve fitting.
- 18 trades is far too few. Two trades removed from the blue line would change the conclusion completely.
- Costs grow with frequency. Here costs took 22 pips over 18 trades. A 1H or 15-minute version of the same idea trades many times more often, and the same spread per trade becomes a large share of the result.
This test does not say moving averages are useless. It says that one in-sample winner is not evidence. For more on the indicator itself, see moving averages.
The traps that make backtests lie
- Overfitting. Too many parameters or too many variations tested. Prefer few rules, round numbers, and settings that work across a neighbourhood (if 20/200 works but 25/200 and 20/150 fail badly, be suspicious).
- Look-ahead bias. Using information that was not known at entry, such as the day's high when entering in the morning, a swing point confirmed three bars later, or a close price when you enter on the open.
- Ignoring costs. Include spread, commission and swap (see swap). Spreads widen around news releases and the daily open, which is also when many setups trigger. See spreads explained.
- Perfect fills. Stops can fill worse than their price in fast markets. Add a slippage allowance; see slippage.
- Data quality. Free hourly data can contain gaps or bad ticks, and broker feeds differ slightly. Spot-check unusual candles. Survivorship bias, a big issue for stocks, matters less in major forex pairs, but the period you choose still matters: three years of trend is not three years of range.
- Changing the rules mid-test. If you edit the rules after seeing a loss, start the test again from the beginning.
Walk-forward and forward testing
Walk-forward testing repeats the in-sample/out-of-sample split on rolling windows: optimise on one block, test on the next, slide forward, repeat. It shows whether the "best" settings stay stable or jump around, which is a warning sign.
Forward testing trades the frozen rules in real time on a demo account or with very small size for at least a few weeks. It catches problems a backtest cannot: missed entries because you were away, hesitation after a losing streak, and real spreads at the times you trade. Compare the forward results with the backtest in R, not in money. Our trading psychology page explains why following rules is harder live.
A simple backtesting checklist
- Rules written so a stranger would take the same trades.
- Data split into in-sample and out-of-sample before you start.
- Costs and a slippage allowance included.
- At least 100 trades, logged in R.
- Expectancy, profit factor, maximum drawdown and longest losing streak calculated.
- Neighbouring settings checked for stability.
- Out-of-sample run once, without changes.
- Forward test on demo before any real money, with risk per trade set from the drawdown you measured.
Common mistakes
- Stopping after 20 good trades. Small samples flatter almost everything.
- Testing until something works. Each extra variation raises the chance that the winner is luck.
- Measuring in pips only. A 30-pip win with a 60-pip stop is only +0.5R, while the same 30 pips with a 10-pip stop is +3R; record R.
- Skipping losing periods. "I would not have traded that week" is hindsight.
- Assuming the backtest drawdown is the worst case. The future can be worse; our simulation shows how wide the luck range is even with a real edge.
- Using the out-of-sample data to tweak the rules. Once you tune on it, it is in-sample.
Our data
The EMA crossover test uses OnForex analysis of hourly prices from Yahoo Finance, January 2024 - October 2026 (EURUSD resampled to 4H, 1.2 pips per round trip, no slippage or swap). The expectancy and drawdown figures come from our Monte Carlo simulation (20,000 runs, 200 trades, 45% win rate, 1.5R reward). These are tests of rules on past data, not a forecast or a recommendation of any setting.
Related guides
- Risk reward ratio and break-even win rates
- Risk per trade and position sizing
- Drawdown and compounding
- Trailing stop and other exit methods
- Forex strategies to choose rules worth testing
Practise on a demo account first
Forward-test your rules on a free Exness demo account before you risk money. Forex and CFD trading carries a high risk of loss.
Continue to ExnessForex and CFD trading involves significant risk. You may lose your invested capital.
Risk warning: Forex and CFD trading carries a high risk of loss and may not be suitable for everyone. Past results, whether real or backtested, do not guarantee future results. This page is education, not investment advice.
Related Articles

Forex Trading Strategies: A Practical Guide (2026)
Trend following, range trading, scalping, swing trading and carry trades explained with entry and exit rules, risk management and how to test a strategy.
Moving Averages in Forex: SMA, EMA, 200-Day Data
Moving averages in forex: SMA vs EMA formulas, 50/200 golden and death crosses, common periods, and what 9 years of daily data show about the 200-day line.
RSI Indicator: Settings, Strategies and What Our Data Shows
RSI indicator guide: Wilder's formula, the 14 setting, overbought and oversold levels and divergence, with tests on four markets of what RSI can do.

Ichimoku Cloud Explained: Five Lines, Signals and Settings
Ichimoku cloud explained: the five lines, how to read the cloud, sanyaku kōten and gyakuten, the 9-26-52 settings and what our daily data shows.
Martingale Strategy in Forex: Why It Blows Up (Simulation)
Martingale and averaging down explained: how doubling after a loss works, why accounts run out of room, our 20,000-run simulation, and safer ways to size.
London Breakout Strategy: Asian Range Rules, Times and Data
London breakout strategy explained: how to mark the Asian range, entry, stop and target variants, false breakouts, UTC and JST times, and our data on four markets.