London Breakout Strategy: Asian Range Rules, Times and Data
London breakout strategy explained: how to mark the Asian range, entry, stop and target variants, false breakouts, UTC and JST times, and our data on four markets.

This site contains affiliate links. We may earn a commission if you sign up through our links. How we research
The London breakout strategy marks the high and low of the quiet Asian session and then watches for price to move beyond that range after London opens. In our hourly data, London took exactly one side of the Asian range on about 71-74% of days for EURUSD, GBPUSD, USDJPY and gold. That makes a break common, but it does not say which way the day ends, and this guide covers the rules, the variants, the false breakouts and the times in UTC and JST.
Disclosure: OnForex may earn a referral commission from Exness links on this page. This is general education, not investment advice.
The strategy sits between a pure breakout strategy and the session ideas in ICT kill zones. If you want the reversal reading of the same range, see the Power of Three page. We do not provide signals or a ready-made system. This is a description of how traders build the setup, with our own numbers on how the range behaves.
Why the London open matters
Forex trades around the clock, but the number of active participants changes through the day. The Asian session (Tokyo, Sydney, Singapore) is usually quiet for EURUSD and GBPUSD. When European banks and funds arrive, the volume and the size of price moves rise at once.
Our hourly data shows it clearly (OnForex analysis of hourly prices from Yahoo Finance, January 2024 - October 2026):
- EURUSD: the quietest hours, 22:00-04:00 UTC, average roughly 6.6-8 pips per hour. London at 07:00-08:00 UTC is about 15 pips. The New York hours, 12:00-15:00 UTC, are the largest at about 17-18.6 pips.
- GBPUSD peaks at 14:00 UTC with an average of 22.9 pips per hour.
- USDJPY peaks near 13:00 UTC at about 33.8 pips and also has a high at 00:00 UTC (31.4 pips) because of Tokyo.
- Gold (XAUUSD, COMEX futures) peaks at 13:00-14:00 UTC at about USD 24 per hour, against about USD 10-13 in the late US and Asian hours.
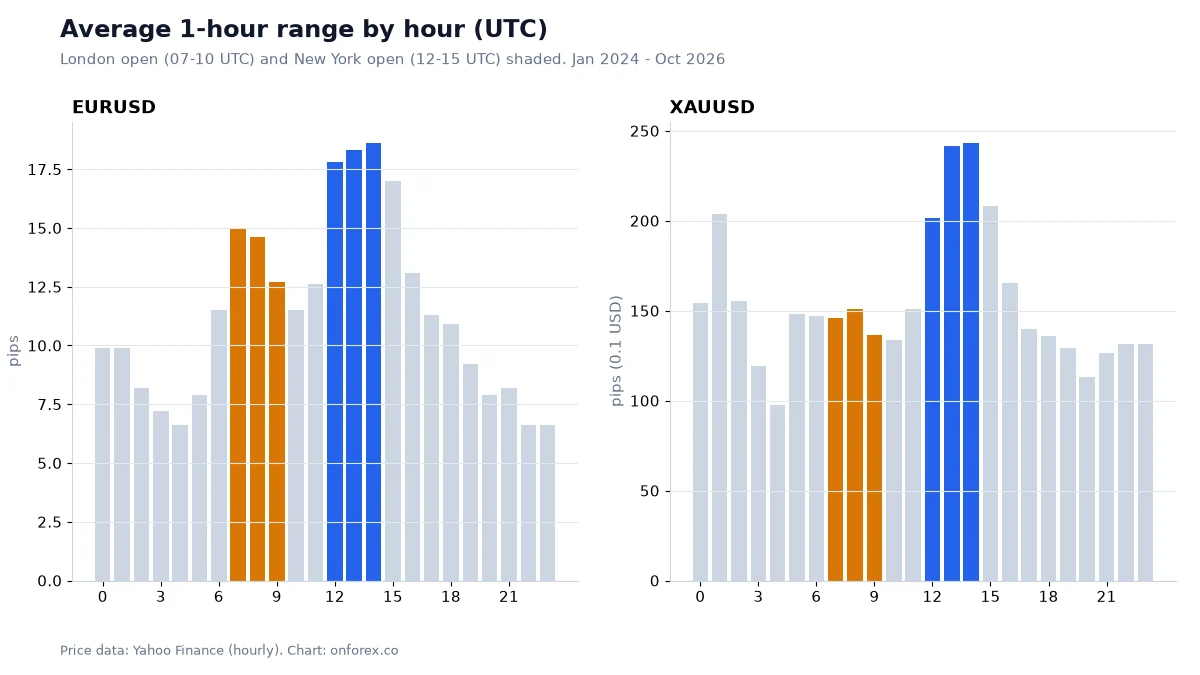
The chart shows a step up at London and a larger step at New York. So the London open does release more movement than the Asian hours, but for EURUSD and gold the peak comes later, in the New York overlap. That is worth remembering when you place a target.
Step 1: Mark the Asian range
The Asian range is the highest high and the lowest low over a fixed window. There is no official window, and traders use several versions:
| Version | UTC | JST (UTC+9) | Notes |
|---|---|---|---|
| Our analysis | 00:00-06:59 | 09:00-15:59 | Fixed UTC hours, same all year |
| Tokyo session | 00:00-09:00 | 09:00-18:00 | Includes the first London hours in summer |
| Narrow range | 00:00-05:00 | 09:00-14:00 | Tighter, more likely to be broken |
Whichever you use, keep it fixed. Changing the window to fit the day is the quickest way to make any backtest look better than it is.
Also check how wide the range is. A 10-pip range on EURUSD is easily broken by spread and noise. A 70-pip range may leave no room for a target before the New York session. Many traders skip days when the range is very narrow or very wide, using a multiple of the ATR (average true range, a measure of typical movement; see our ATR indicator page) as the filter.
Session times in UTC and JST, with daylight saving
London opens at 08:00 local time. The United Kingdom uses Greenwich Mean Time in winter and British Summer Time in summer. The change dates are the last Sunday in March and the last Sunday in October. Japan has no daylight saving.
| Season | London open (UTC) | London open (JST) | New York open (UTC) | New York open (JST) |
|---|---|---|---|---|
| Northern winter | 08:00 | 17:00 | 14:30 (stocks) / 13:00 (FX desks) | 23:30 / 22:00 |
| Northern summer | 07:00 | 16:00 | 13:30 (stocks) / 12:00 (FX desks) | 22:30 / 21:00 |
The United States changes its clocks on different dates: second Sunday in March and first Sunday in November. For a few weeks each spring and autumn, the gap between London and New York is different from usual. A window written in fixed UTC hours therefore drifts by an hour against the real session. When you backtest, decide whether you fix the strategy in UTC or in London local time, and apply it to every day.
Step 2: Choose how you will enter
Traders trade the same range in several ways. None of the following is better by default, and each has a cost.
Variant A: Stop orders beyond the range. A buy stop is placed a few pips above the Asian high and a sell stop below the low. When one is triggered, the other is cancelled. This is quick but is also exposed to false breakouts and slippage, because stop orders fill at the next available price, which may be worse around the open when spreads widen.
Variant B: Candle-close confirmation. The trader waits for a 15-minute or 1-hour candle to close beyond the range before entering. This avoids many wicks but gives a worse entry price, since part of the move has already happened.
Variant C: Break and retest. After the close beyond the range, the trader waits for price to pull back to the broken level and hold. This improves the stop distance but misses strong moves that never pull back.
Variant D: Fade the first break. If price runs through one side and closes back inside, some traders trade the other direction. This is the Power of Three reading described on our Power of Three page, and it depends on the same liquidity sweep idea.
Step 3: Place the stop and the target
Stops and targets are where most of the strategy's outcome is decided. These are the usual options, described generally:
| Element | Options traders use | Trade-off |
|---|---|---|
| Stop | Opposite side of the range; the middle of the range; a multiple of ATR from entry; beyond the breakout candle's wick | A wider stop survives noise but needs a smaller position size |
| Target | A fixed multiple of the stop (1.5R, 2R); the range height projected from the break; the previous day's high or low; a time exit at a set hour | Targets beyond the New York open face a new volatility spike |
| Time exit | Close the trade by a fixed hour, such as 12:00 UTC | Avoids holding into New York news |
Here R means the amount you risk on the trade. A 2R target pays twice the amount at risk. See risk-reward ratio for the break-even win rates.
Our data gives one useful reference for the stop distance: how often a randomly placed stop gets hit within 24 hours.
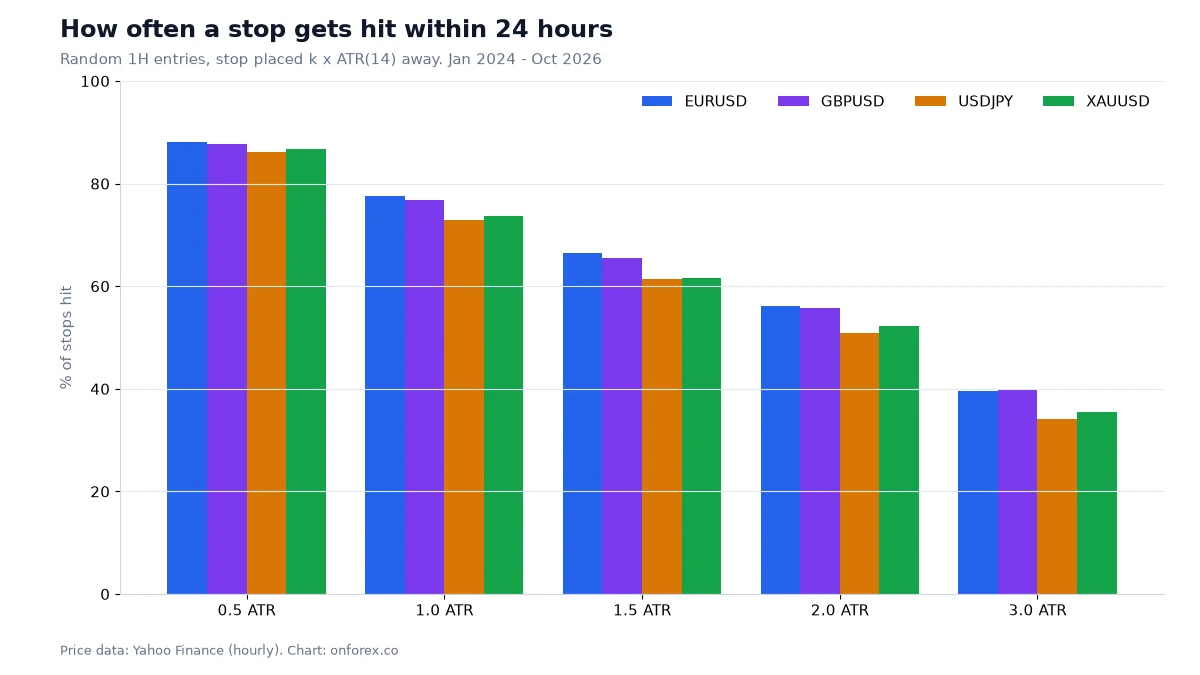
For a random entry, a stop of 0.5 ATR was hit in 86-88% of cases, 1 ATR in 73-78%, 2 ATR in 51-56% and 3 ATR in 34-40%. This is not a test of the London breakout, since entries were random. It shows that a tight stop will be hit most of the time by normal movement. For scale: the median EURUSD Asian range in our data was 20.8 pips (middle half of days 15.7-29.7 pips), about 2.6 times the 1-hour ATR at the end of the Asian session, so a stop on the far side of the whole range sits about 2.6 ATR away, while a stop at the range midpoint is closer to 1.3 ATR.
A worked example (hypothetical numbers)
The prices below are illustrative, not a trade from our records, and not a signal.
- Asian range: high 1.1050, low 1.1020, so 30 pips high.
- A trader uses Variant B and waits for a 1-hour candle to close above 1.1050 after 07:00 UTC. It closes at 1.1058.
- Stop: the middle of the range at 1.1035, which is 23 pips below entry.
- Target: 2R, so 46 pips above entry at 1.1104.
- Account: USD 1,000, risk 1%, so USD 10. Pip value is about USD 10 per standard lot on EURUSD. Position size: 10 / (23 x 10) = 0.043, so 0.04 lots.
Two things change this. The spread at the open may add 1-2 pips of cost on each side, and a gap through the stop may fill worse than 1.1035. Always compute the position from the real stop distance, as in our position sizing guide.
Now the real chart. On 21 September 2026 on EURUSD, London first ran through the Asian high, which would have triggered a buy-stop breakout trader, and then the day closed below the Asian low.
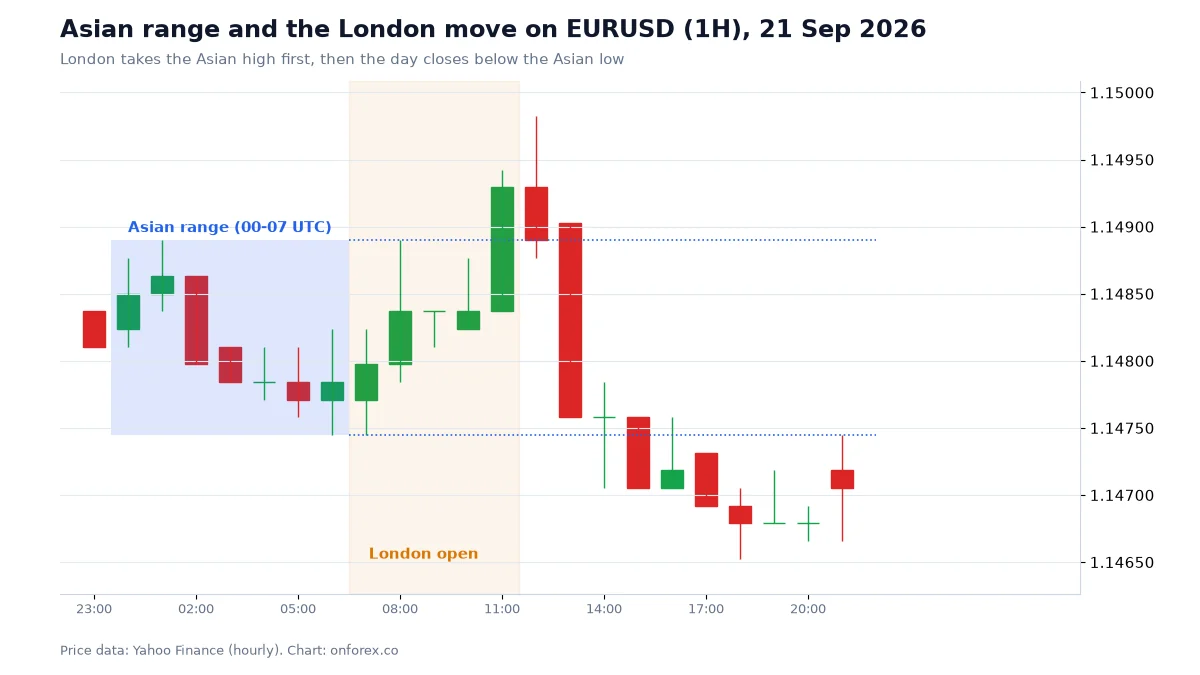
This is a false breakout. Without the chart you cannot tell, at the time of the first break, whether it is real.
Our data: what London does to the Asian range
We tested 722 trading days for EURUSD and GBPUSD, 721 for USDJPY and 579 for gold. A trading day is 22:00-22:00 UTC, the Asian range is 00:00-06:59 UTC and the London window is 07:00-11:59 UTC. Source: OnForex analysis of hourly prices from Yahoo Finance, January 2024 - October 2026 (gold: June 2024 - October 2026, COMEX gold futures).
| London window result | EURUSD | GBPUSD | USDJPY | XAUUSD |
|---|---|---|---|---|
| Took exactly one side of the range | 74.4% | 73.8% | 71.2% | 71.8% |
| Took both sides | 16.9% | 20.1% | 5.4% | 4.7% |
| Took neither side | 8.7% | 6.1% | 23.4% | 23.5% |
| Day closed beyond the Asian midpoint on the other side | 29.2% | 26.5% | 19.1% | 23.3% |
The last row counts days when London took exactly one side. How to read it:
- A break of the Asian range in the London window is the norm, not a signal in itself.
- On EURUSD and GBPUSD, London took both sides on 17-20% of days. A breakout trader with a stop on the opposite side would have been stopped on many of those days, and a trader with stop orders on both sides could have been triggered both ways.
- A fake move followed by a close on the opposite side of the midpoint occurred on about 19-29% of one-sided days. So a first break was more often continuation than a reversal, but a fifth to a quarter of the time it fails by the close.
- USDJPY and gold took neither side on about 23% of days, so the strategy would have had no trade on those days.
We did not test complete entry and exit rules, so we cannot give a win rate or return. The data tells you how often the range gets broken and how often the break fails. It does not tell you whether a given set of rules makes money after costs.
Common mistakes
- Trading every day. About 6-24% of days have no break at all, and a narrow range is often just noise.
- Pending orders with a tight stop. The spread widens around the open and the news, and stop orders can fill with slippage.
- No time exit. A trade that stays open into the New York session faces a second volatility burst. Decide in advance when you stop watching it.
- Ignoring the calendar. Employment data, central bank decisions and inflation releases cause spikes of their own. Check the economic calendar first.
- Moving the range window to fit hindsight. Fix the hours once.
- Doubling after a stop-out. Increasing size after a loss is a martingale approach and can end an account quickly. Keep the risk per trade fixed, as in risk per trade.
- Forgetting daylight saving. Winter and summer London opens differ by an hour in UTC.
Related guides
- Power of Three: the reversal reading of the Asian range
- Breakout strategy: general rules for range breakouts
- ICT kill zones: session windows and hourly ranges
- Trading hours: sessions in your time zone
- ATR indicator: sizing a stop with volatility
- Stop loss: where to place and how to size it
Practise before you risk money
Practise on a demo account first
Mark the Asian range and test entries and stops on a free Exness demo account before you risk money. Forex and CFD trading carries a high risk of loss.
Continue to ExnessForex and CFD trading involves significant risk. You may lose your invested capital.
Risk warning: Forex and CFD trading carries a high risk of loss and is not suitable for everyone. A London breakout can fail, spreads widen at the open and stops can fill at worse prices. Nothing here guarantees a profit. Data: OnForex analysis of hourly prices from Yahoo Finance, January 2024 - October 2026 (gold: June 2024 - October 2026, COMEX gold futures). Past results do not indicate future results.
Related Articles

ICT Kill Zones: London, New York and Asia Times (UTC) With Data
ICT kill zones explained with times in UTC and New York time, how daylight saving shifts them, and our hourly range data for EURUSD, GBPUSD, USDJPY and gold.

Breakout Trading Strategy: How to Trade Forex Breakouts
Master forex breakout trading in 2026. Learn how to identify real breakouts, filter false breaks with volume, and apply precise entry and exit rules to capture big moves.

Inside Bar Strategy: How to Trade It, With Data on 1,773 Setups
What an inside bar is, how to read the mother bar, three ways to trade the break, and what 1,773 inside bars on EURUSD, GBPUSD, USDJPY and gold showed.

ICT Silver Bullet: Times, Rules and What Our Data Shows
The ICT silver bullet strategy: the 10-11 am New York window, the sweep-and-FVG entry, time zone conversions, and our data on what that hour does.

Forex Trading Hours: Market Sessions in Your Local Time (2026)
Forex trading hours in GMT and local time for New York, London, Tokyo, Sydney, Dubai, Lagos, Nairobi, Mumbai, Manila, Jakarta and Kuala Lumpur, plus DST notes.
ATR Indicator: Formula, Settings and ATR Stop-Loss in Forex
ATR explained: how Average True Range is calculated with a worked example, the 14-period setting, ATR stops, position sizing and our stop-hit data.