Martingale Strategy in Forex: Why It Blows Up (Simulation)
Martingale and averaging down explained: how doubling after a loss works, why accounts run out of room, our 20,000-run simulation, and safer ways to size.
This site contains affiliate links. We may earn a commission if you sign up through our links. How we research
The martingale strategy is a staking system in which you increase your position size after every loss, normally doubling it, so that the first win recovers all earlier losses plus one unit of profit. Averaging down (adding to a losing trade) shares the same structure: the position grows exactly when the trade is going wrong. Both work on paper only if your account and your broker's limits are infinite, and in our simulation doubling after every loss ruined 62.8% of accounts within 200 trades.
Disclosure: OnForex may earn a referral commission from Exness links on this page. This is general education, not investment advice.
This page explains how martingale and anti-martingale work, shows the arithmetic with real numbers, and reports our own simulation. We do not recommend martingale or averaging down without a stop, and the reasons below are numbers, not opinions. Many traders try it because the early results look so good, and that is exactly why it is worth understanding properly.
How the martingale strategy works
Martingale comes from a gambling system. You bet 1 unit. If you lose, you bet 2. If you lose again, you bet 4, then 8, and so on. When you finally win, the win pays back every earlier loss and leaves you exactly 1 unit ahead.
| Trade in the sequence | Stake | Total lost before it | Result if it wins |
|---|---|---|---|
| 1 | 1 unit | 0 | +1 |
| 2 | 2 units | 1 | +1 |
| 3 | 4 units | 3 | +1 |
| 4 | 8 units | 7 | +1 |
| 5 | 16 units | 15 | +1 |
| 6 | 32 units | 31 | +1 |
| 7 | 64 units | 63 | +1 |
The pattern is simple: after n losses in a row you have lost (2^n - 1) units and the next stake is 2^n units. Notice what the system pays for all that risk: one unit per cycle, however deep the cycle goes.
In forex, traders adapt it in a few ways:
- Doubling the lot size after a losing trade, with the same stop and target.
- Adding to a losing position at a worse price (averaging down), so the break-even point moves closer.
- Grid or recovery systems that open extra positions at fixed price steps against the trade, often with larger sizes at deeper levels.
All three increase exposure as price moves against the original idea.
Why martingale feels like it works
Martingale has a very high hit rate by design. If every individual trade wins 50% of the time, then the chance that a cycle of 6 trades contains at least one win is 1 - (0.5^6) = 98.4%. A trader who tests this for a few weeks will see a clean, rising equity line.
The problem is hidden in the other 1.6%. A cycle of six losses in a row has a probability of 1 in 64. In our Monte Carlo test of a method that wins 45% of trades (200 trades per run), the longest losing streak had a median of 8 and a 90th percentile of 11. Streaks of that length are normal, not freak events, and this is a method with a positive expected value. Real-market losing streaks also cluster, because trades taken in the same conditions are not independent.
Martingale does not change the expectancy of each trade. It reshapes the distribution of results: many small wins, rare catastrophic losses. If the expectancy per trade is zero or negative (and costs such as spread make it negative), adding size cannot fix it.
The arithmetic of running out of room
Take a 1,000 USD account and a first stake of 10 USD (1%), doubling after every loss.
- After 1 loss, the next stake is 20 USD. Total loss: 10 USD.
- After 5 losses, the next stake is 320 USD. Total loss: 310 USD (31% of the account).
- After 6 losses, the next stake is 640 USD. Total loss: 630 USD (63%).
- After 7 losses, the next stake would be 1,280 USD, but only 370 USD is left.
The seventh stake cannot be placed. In forex it is worse than that, because positions use margin, spreads and swaps cost money on every position, and a broker may close positions automatically at a stop-out level before you get that far.
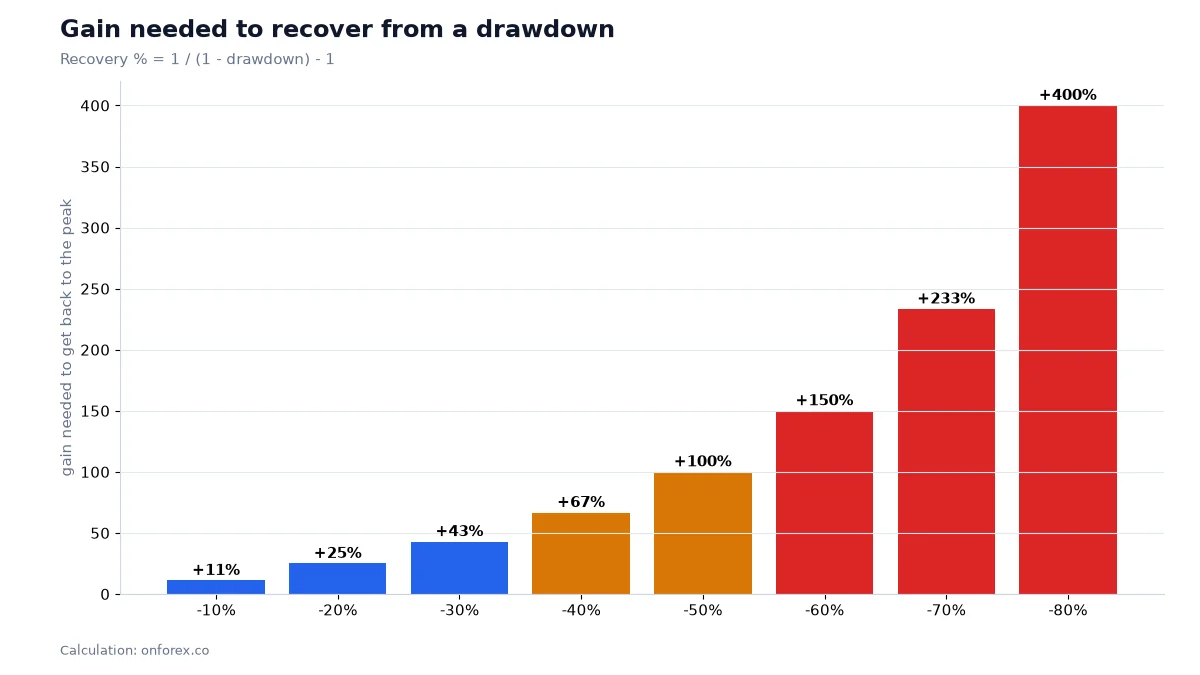
You also need the recovery maths. A 63% loss needs a gain of about 170% to get back to even; the table in our drawdown guide shows how fast this grows (a 50% loss needs +100%, a 70% loss needs +233%).
Averaging down: the same trap with a different name
Averaging down (called "nanpin" in Japanese trading slang) means buying more as price falls, or selling more as price rises, to bring the average entry price closer to the market. It feels sensible: a lower average price means a smaller bounce is needed.
Here is a worked example on EURUSD with a 10,000 USD account. All numbers are illustrative.
| Step | Action | Size | Price |
|---|---|---|---|
| 1 | Buy | 0.10 lots | 1.1000 |
| 2 | Buy more | 0.20 lots | 1.0950 |
| 3 | Buy more | 0.40 lots | 1.0900 |
The average entry is (0.1 x 1.1000 + 0.2 x 1.0950 + 0.4 x 1.0900) / 0.7 = 1.0929. Price now needs to rise only about 29 pips from 1.0900 to break even, instead of 100 pips for the first entry alone.
But look at the other side. If price keeps falling to 1.0850:
- First entry alone: 150 pips x 0.10 lots x 10 USD per pip per lot = 150 USD loss.
- All three entries: 0.10 x 150 x 10 + 0.20 x 100 x 10 + 0.40 x 50 x 10 = 150 + 200 + 200 = 550 USD loss.
The loss is more than three times larger, and the position is seven times the original size. On a 10,000 USD account that is 5.5% lost on a trade planned at roughly 1.5% risk, and no stop-loss has been defined for the point at which the idea is wrong. Averaging down is a decision to raise risk when the market has just told you that you were wrong.
Averaging into a position can be done safely only when the total risk was planned before the first entry. For example: planning to enter in three equal parts with one common stop-loss, and sizing so that the whole stack risks 1%. That is scaling in with a plan, not averaging down to avoid a loss.
Our simulation: 20,000 accounts, 200 trades
To show the effect without real money at risk, we ran a Monte Carlo test. Each run is 200 coin-flip trades: 50% win rate, reward equal to risk (1:1), so the expected value before costs is zero. The starting stake was 1% of the starting balance. An account counted as ruined if it could no longer cover the next stake or fell to 10% of its start.
| Staking rule | Accounts ruined | Median ending balance |
|---|---|---|
| Double after each loss (martingale) | 62.8% | 0.57x |
| Multiply by 1.5 after each loss | 15.4% | 1.10x |
| Fixed 1% of equity | 0% | 0.99x |
Source: OnForex Monte Carlo simulation, 20,000 runs of 200 trades each, run in October 2026. Costs such as spread are not included, so real results would be worse.
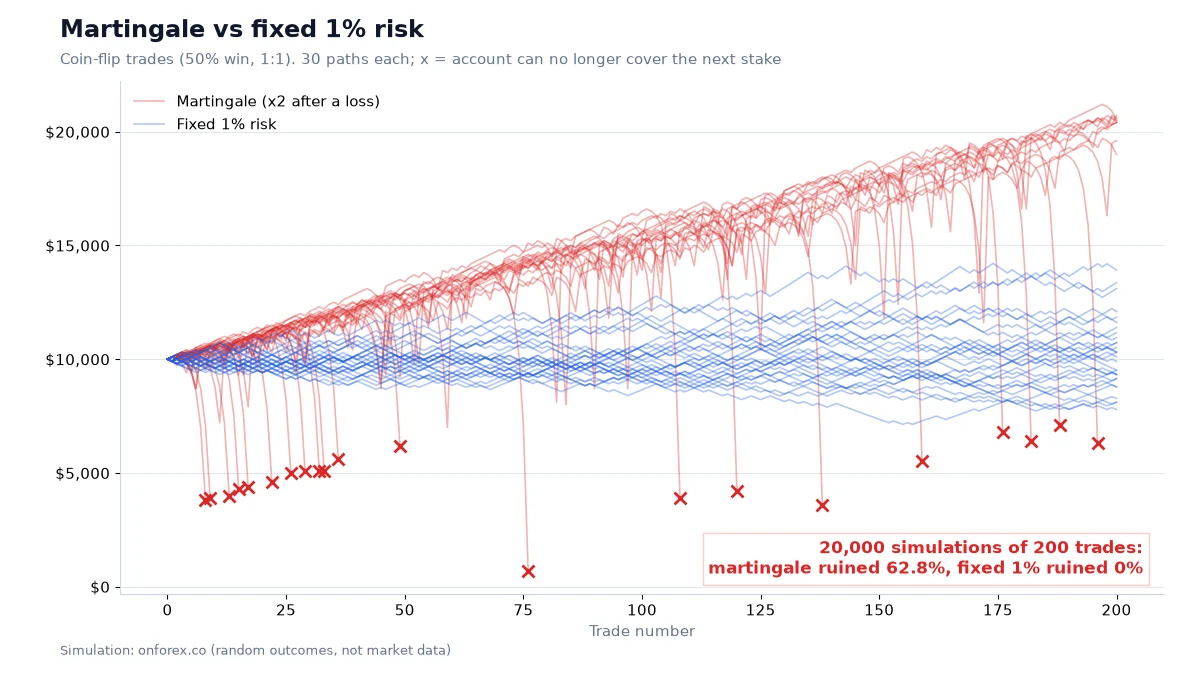
Notice three things:
- The fixed-risk traders did not lose money by design. Their median ending balance was 0.99x, which is what a zero-edge method should do. They simply survived.
- Martingale ruined most accounts even though each flip was fair. The long tail of rare, deep losing streaks arrived often enough in 200 trades to end the account.
- A gentler multiplier is still dangerous. Multiplying by 1.5 reduced ruin to 15.4%, but a 15.4% chance of losing nearly everything is not a small risk.
The honest summary: martingale does not create profit from nothing. It converts a steady stream of small losses into a rare but very large one, and usually hides the large one for a while.
What about anti-martingale?
The anti-martingale is the mirror image: you increase size after wins and reduce or reset size after losses. The logic is that you press when conditions are favourable (a winning streak) and shrink when they are not.
Advantages:
- Losses stay small during a bad run, because size falls as you lose.
- Gains can compound during a good run.
Drawbacks:
- If wins and losses are independent, a winning streak does not predict the next result, so extra size after wins has no edge by itself.
- A single loss after a big streak can wipe out several wins, because it is taken at the largest size.
- It still needs a stop-loss and a cap, or one large position can do serious damage.
A conservative version of this idea is simply fixed fractional sizing, where the dollar risk rises as equity rises and falls as equity falls. That is exactly what the 1% rule does, and our risk per trade guide shows how it behaves in simulation.
Grid trading and "recovery" systems
Grid and recovery systems are popular because they look like a process: open a position, add another every 20 pips against it, close everything when the average is back in profit. Whether this is dangerous depends on three things.
- Size progression. Equal sizes grow risk linearly; larger sizes at each level are martingale.
- A hard stop. A grid with no maximum loss relies on price coming back, and gold or a trending pair may not.
- Costs. Each added position pays spread, and spreads widen around news and the daily rollover, when several levels can open at poor prices at once.
Stops also have to deal with slippage: in a fast move your stop-loss may fill beyond its price. A plan that depends on a stop being filled exactly is less safe than it looks. See our slippage guide for how it happens.
Safer ways to size trades
If you want something that survives a bad run, the tools are simpler than martingale:
- Fix the risk before entering. Choose 0.5% to 2% of equity per trade and set the stop-loss before you press buy or sell. Our position sizing guide has the formula.
- Calculate lots from the stop. For a 10,000 USD account, 1% risk is 100 USD. With a 20-pip stop on EURUSD and 10 USD per pip per lot, that is 100 / (20 x 10) = 0.5 lots.
- Shrink size during drawdowns. If equity falls 10%, many traders cut the risk per trade in half until it recovers. This is the opposite of martingale.
- Cap the number of open positions and the total risk across correlated pairs. See correlation.
- Use a stop-loss at a level where your idea is wrong, and accept that a stopped trade is a cost of doing business.
- Think in R. Measure each trade as a multiple of the amount risked, and judge a method over many trades using the risk reward ratio and the money management rules.
Nothing here guarantees a profit. It simply keeps a normal losing streak from ending your account while you find out whether your method has an edge.
Common mistakes
- Treating a high win rate as safety. A 98% win rate with an occasional 60% loss is not safe.
- Testing on a short, calm sample. A few months of range-bound conditions will not include the streak that ends the account.
- Ignoring costs. Spreads, swaps and commissions make a zero-edge method negative, and they scale with position size.
- Moving the stop after adding. Adding to a loser and then widening or removing the stop turns a defined risk into an open-ended one.
- Averaging down because of an emotion. Wanting to be "right" or to avoid realising a loss is a psychological pull; read our trading psychology page.
- Not knowing your maximum position. Before the first trade, know what lot size you would reach at level 5 or 6 and whether your account could carry it.
Our data
All numbers on this page come from our own simulation (20,000 runs of 200 coin-flip trades) and from the Monte Carlo risk-per-trade test described in our risk per trade guide: a method with a positive edge (45% win rate, 1.5R reward) risking 1% per trade had a median maximum drawdown of 11.7%, while risking 5% produced 49.2% and a 96.9% chance of a drawdown of at least 30%. The longest losing streak in 200 trades had a median of 8 and a 90th percentile of 11.
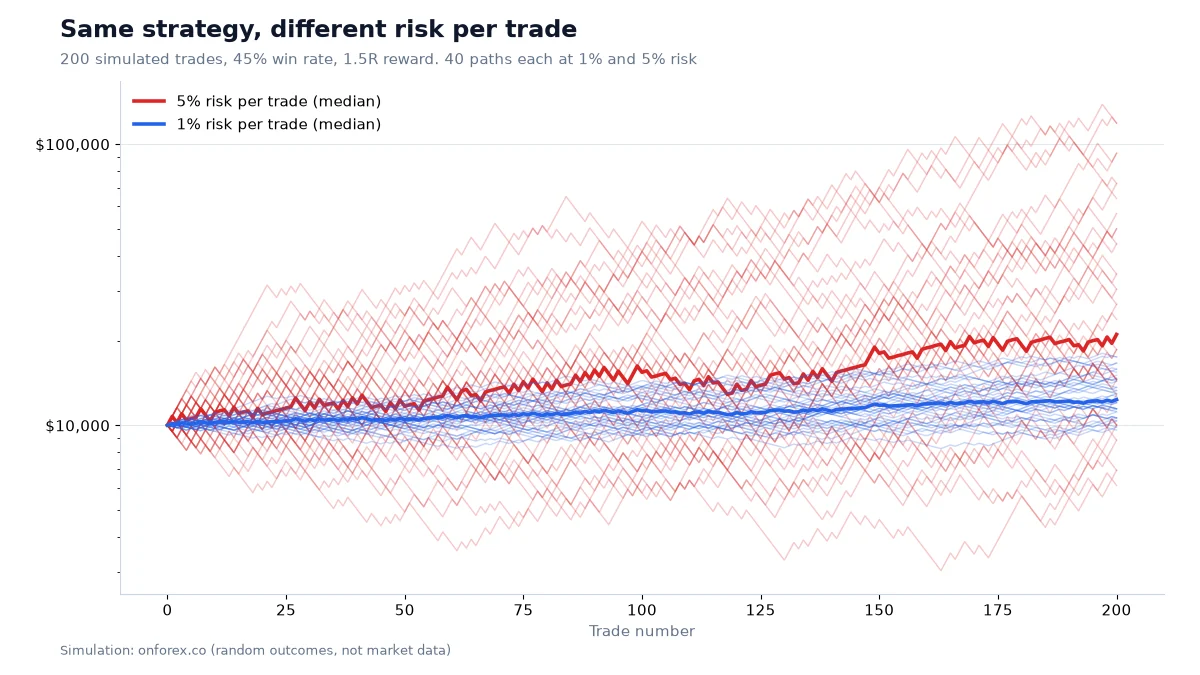
These are simulations, not forecasts of any real trader's results. Real markets have fat tails, gaps and spreads that are not in a coin-flip model.
Related guides
- Drawdown and the recovery table
- Risk per trade: the 1-2% rule
- Position sizing and lot size
- Stop-loss and ATR indicator for stop placement
- Risk management and psychology
Practise on a demo account first
Test position sizing and stop placement on a free Exness demo account before you risk money. Forex and CFD trading carries a high risk of loss.
Continue to ExnessForex and CFD trading involves significant risk. You may lose your invested capital.
Risk warning: Forex and CFD trading carries a high risk of loss and may not be suitable for everyone. Martingale and averaging down can lose your entire account. Simulations are not a forecast of future results. This page is education, not investment advice.
Related Articles
Forex Day Trading Guide 2026: Sessions, Setups and Risk
A practical guide to forex day trading: which sessions to trade, entry and exit rules, position sizing, and the mistakes that most often cost day traders money.
Risk Reward Ratio in Forex: R Multiples, Win Rate and Expectancy
Risk reward ratio explained with R multiples, the break-even win rate table, an expectancy formula with worked examples, and why a higher ratio is not always better.
Breakout Trading Strategy: How to Trade Forex Breakouts
Master forex breakout trading in 2026. Learn how to identify real breakouts, filter false breaks with volume, and apply precise entry and exit rules to capture big moves.
Forex Risk Management: How to Calculate Risk per Trade
Forex risk management step by step: calculate lot size from a 1% risk and a stop-loss, with USD 1,000 and USD 2,000 EUR/USD examples, drawdown and analytics.
Inside Bar Strategy: How to Trade It, With Data on 1,773 Setups
What an inside bar is, how to read the mother bar, three ways to trade the break, and what 1,773 inside bars on EURUSD, GBPUSD, USDJPY and gold showed.

London Breakout Strategy: Asian Range Rules, Times and Data
London breakout strategy explained: how to mark the Asian range, entry, stop and target variants, false breakouts, UTC and JST times, and our data on four markets.