Stop Loss in Forex: Where to Place It (ATR, Structure, Pips)
Where to place a forex stop loss: structure-based, ATR-based and fixed-pip stops compared, how stop distance sets lot size, slippage, gaps, trailing and BE.
This site contains affiliate links. We may earn a commission if you sign up through our links. How we research
A stop loss is an order that closes your position automatically when price reaches a level you chose in advance, which limits the loss on that trade. The best place for it is the price where your trade idea is proven wrong, and the position size is then calculated from the distance to that price. This guide compares the three common ways to choose that level, shows how stop distance drives lot size, and uses our own data on how often random stops get hit.
Disclosure: OnForex may earn a referral commission from Exness links on this page. This is general education, not investment advice.
What a stop does and does not do
A stop loss does three jobs. It caps the amount you can lose on one trade, it removes the need to make a decision while a trade is going against you, and it defines 1R, the risk you take in a single trade, which is the unit for judging results. We explain R in the risk-reward ratio guide.
What it does not do is guarantee the exit price. Once triggered, a stop becomes a market order. In fast markets the fill can be worse (slippage), and over a weekend or a major news release price can jump past it (a gap). Spreads also widen around news and session opens, and a stop on a buy position is triggered by the sell price, so a widened spread can close a trade that the chart never "touched". Our slippage guide explains this in detail.
Three ways to choose the level
| Method | How it works | Strength | Weakness |
|---|---|---|---|
| Structure-based | Beyond a swing high/low or the zone you entered from | Tied to the trade idea | Distance varies; can be wide |
| ATR-based | A multiple of ATR(14) from entry | Adapts to current volatility | Ignores chart structure |
| Fixed pips | Same number of pips every time | Simple and consistent | Ignores pair, hour and volatility |
ATR (average true range) is the average size of recent candles, usually over 14 periods. If ATR(14) on the hourly EURUSD chart is 10 pips, a candle typically moves about 10 pips.
1. Structure-based stops
Put the stop just beyond the level that would show your idea is wrong: under the swing low for a long, above the swing high for a short, or beyond an order block or fair value gap you entered from. Add a small buffer, such as 0.2 ATR, for noise and spread. If price is "just" a few pips beyond an obvious level, it often pokes there first; this is the liquidity sweep behaviour, so a buffer beyond the level is generally wiser than a stop sitting exactly on it.
2. ATR-based stops
Measure ATR(14) on your trading timeframe and place the stop at a multiple of it, say 1.5 ATR. The benefit is that quiet pairs get tight stops and active ones get wide stops automatically. The risk is a stop that lands in the middle of nowhere on the chart.
3. Fixed-pip stops
A flat 20 pips on everything is easy to remember, but 20 pips on EURUSD during the quiet 22:00-04:00 UTC hours is a very different distance from 20 pips on USDJPY at the 13:00 UTC peak. If you use fixed pips, use different values for different pairs and sessions, and recheck them against ATR. Our trading hours guide shows when ranges expand.
How far is "too tight"? Our stop-hit data
To see how much noise a stop must survive, we simulated entering at a random hour in a random direction and checked whether a stop at k times ATR(14) was hit within 24 hours.
Source: OnForex analysis of hourly prices from Yahoo Finance, January 2024 - October 2026 (gold: June 2024 - October 2026, COMEX gold futures).
| Stop distance | EURUSD | GBPUSD | USDJPY | XAUUSD |
|---|---|---|---|---|
| 0.5 ATR | 88% | 88% | 86% | 87% |
| 1 ATR | 78% | 77% | 73% | 74% |
| 1.5 ATR | 66% | 66% | 61% | 62% |
| 2 ATR | 56% | 56% | 51% | 52% |
| 3 ATR | 40% | 40% | 34% | 35% |
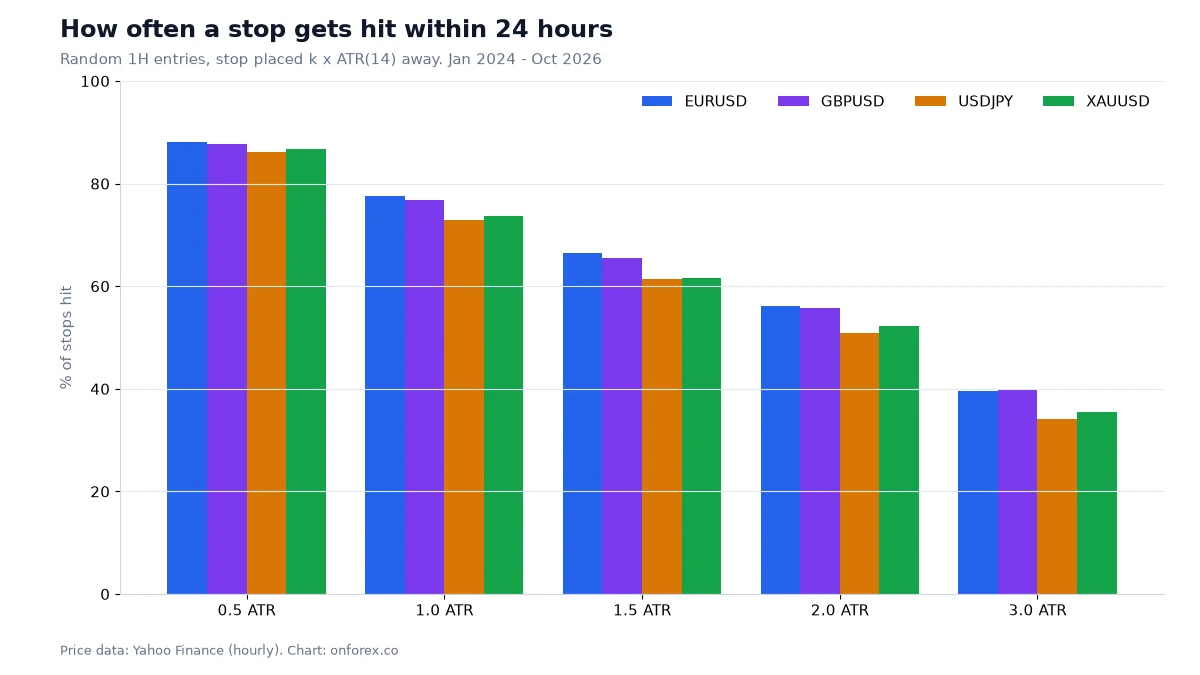
A stop of 0.5 ATR was hit in 86% to 88% of random trades within a day. Even 2 ATR was touched about half the time. This does not say stops are bad; it says that a stop of a few pips is almost certain to be hit by noise alone, with no relation to your idea. A wider stop with a smaller position is usually the better trade-off than a tight stop with a large one.
Stop distance sets the position size
The order matters: decide the stop, then calculate the size. With a risk of 1% on a USD 1,000 account (USD 10) and a pip value of about USD 10 per standard lot on EURUSD:
| Stop distance | Lots (10 / (pips x 10)) | Rounded down |
|---|---|---|
| 7.4 pips | 0.135 | 0.13 lots |
| 15 pips | 0.067 | 0.06 lots |
| 30 pips | 0.033 | 0.03 lots |
Doubling the stop halves the position, and the dollar risk stays about the same. Widening a stop without reducing the size is not risk management; it is just taking more risk. For the formulas see position sizing, lot size and pip value.
Worked example in R
Here is a plan we drew on a real chart: EURUSD 1H, 28 October 2026, 14:00 UTC. Entry 1.11321 at the top of a bullish order block. The stop is 1.11247, which is 7.4 pips below the block with a 0.2 ATR buffer. The target is 1.11469, which is 2R. For a 1% risk on USD 1,000 the size is 10 / (7.4 x 10) = 0.135, which rounds down to 0.13 lots.
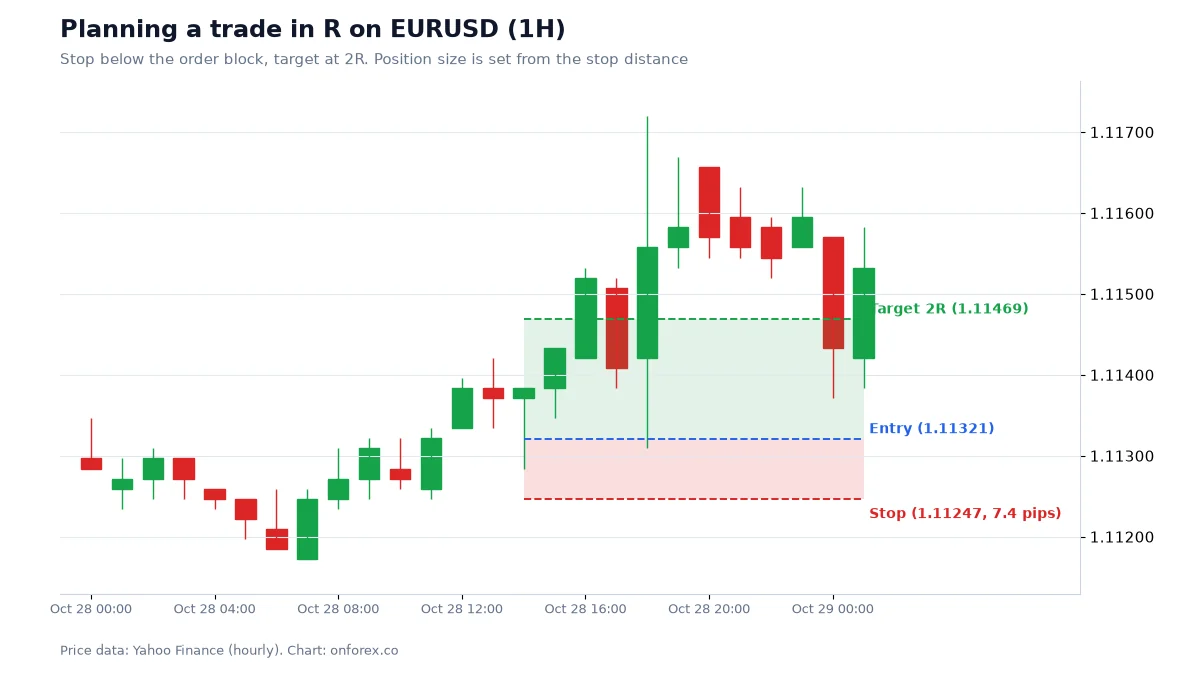
The target was reached before the stop in this case. One trade proves nothing; the plan is useful because the loss was fixed at 1R before entry and the gain was 2R. If it had stopped out, the loss would have been about USD 10. Gap and slippage risk still apply.
Trailing stops and break even
A trailing stop follows price at a set distance as the trade moves in your favour. A break-even stop (BE) moves the stop to the entry price. Both reduce risk, but both also remove trades that would have recovered.
- Move to BE only after a structural reason, such as a new higher low forming above your entry, not after a fixed number of pips.
- Trail below swing lows (for longs) or a multiple of ATR, so the stop sits outside normal noise.
- Consider a partial exit at 1R and leave the rest, but test it on a demo account first to see if it suits your style.
Common mistakes
- Choosing a stop that fits your lot size rather than your idea. Choose the stop first.
- Moving the stop further away after the trade goes wrong. That turns a 1R loss into a larger one. The loss limit is the point.
- Using a stop only in your head. In a fast market, you hesitate. Place the order.
- Ignoring spread and slippage on small stops. A 5-pip stop with a 1.5-pip spread has already lost 30% of its room.
- Holding through the weekend with a tight stop. Gaps can fill beyond it.
- Risking too much per trade. Even with a stop, a streak of losses will happen. In our simulation of 200 trades (45% win rate, 1.5R reward), the median longest losing streak was 8 trades. See risk per trade and drawdown.
Related guides
Stops are one part of the wider risk management and money management approach. If you scalp or day trade, see scalping strategy and day trading for stop sizes that match shorter timeframes, and psychology for why traders move stops.
Practise on a demo account first
Mark structure, FVGs and stops on a free Exness demo account before you risk money. Forex and CFD trading carries a high risk of loss.
Continue to ExnessForex and CFD trading involves significant risk. You may lose your invested capital.
Risk warning: Forex and CFD trading carries a high risk of loss and is not suitable for everyone. A stop loss does not guarantee an exit price and can fill worse than planned. Never risk money you cannot afford to lose.
Related Articles
Trailing Stop Loss in Forex: Trailing, Break Even and Partial TP
How a trailing stop loss works in forex, plus break even stops and partial take profit, compared on the same EURUSD entries with our own test data.
ATR Indicator: Formula, Settings and ATR Stop-Loss in Forex
ATR explained: how Average True Range is calculated with a worked example, the 14-period setting, ATR stops, position sizing and our stop-hit data.
Forex Risk Management: How to Calculate Risk per Trade
Forex risk management step by step: calculate lot size from a 1% risk and a stop-loss, with USD 1,000 and USD 2,000 EUR/USD examples, drawdown and analytics.
Forex Lot Size 2026: What a Lot Is and How to Calculate It
Forex lot size explained. Standard, mini, and micro lots defined. Position size calculation formula with examples. Includes Exness calculator guide.
Forex Order Types: Market, Limit, Stop and OCO Explained
Forex order types explained: market, buy limit, sell limit, buy stop, sell stop, stop loss, take profit, trailing stop, OCO and slippage, with a EURUSD example.
Risk Reward Ratio in Forex: R Multiples, Win Rate and Expectancy
Risk reward ratio explained with R multiples, the break-even win rate table, an expectancy formula with worked examples, and why a higher ratio is not always better.