Fair Value Gap (FVG): Meaning, Marking and Fill Rates
Fair value gap (FVG) explained: how to spot a three-candle imbalance, the 50% CE level, inverse FVG, BPR, and how often gaps were filled in our own data.
This site contains affiliate links. We may earn a commission if you sign up through our links. How we research
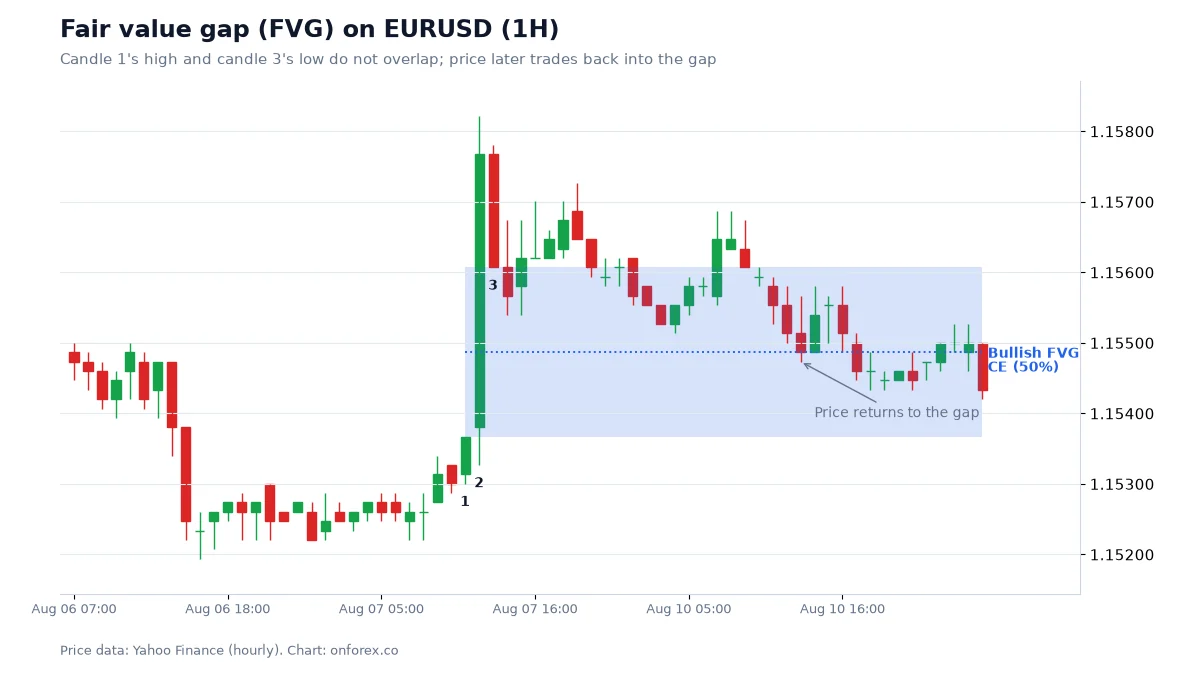
A fair value gap (FVG) is a three-candle pattern in which the wick of candle 1 and the wick of candle 3 do not overlap, so a gap is left across the body of the fast candle in the middle. Traders call that gap an imbalance because price crossed it quickly and little trading happened inside it. In our hourly data, most gaps were revisited within a day, but being revisited is not the same as being a trade.
Disclosure: OnForex may earn a referral commission from Exness links on this page. This is general education, not investment advice.
Below you will find how to spot and measure a gap, what the 50% CE level is, how an inverse FVG and a balanced price range (BPR) fit in, and what our own price data says about how often gaps are filled.
What is a fair value gap?
Take any three consecutive candles. In an up-move, a bullish FVG exists when the high of candle 1 is lower than the low of candle 3. The space between those two prices is the gap. Candle 2 is the strong candle that did the moving. In a down-move, a bearish FVG exists when the low of candle 1 is higher than the high of candle 3.
| Bullish FVG | Bearish FVG | |
|---|---|---|
| Condition | Low of candle 3 > high of candle 1 | High of candle 3 < low of candle 1 |
| Gap edges | High of candle 1 to low of candle 3 | Low of candle 1 to high of candle 3 |
| Watched as | Possible support on a pullback | Possible resistance on a rally |
The name "fair value" is a label, not a measurement: nobody knows the fair value of EURUSD. What the pattern really says is "this stretch of prices was skipped".
An example with numbers
These numbers are illustrative, not a recorded trade. Suppose three EURUSD hourly candles show the high of candle 1 at 1.0850 and the low of candle 3 at 1.0868. The gap is 18 pips wide, and its 50% level (CE) is 1.0859. If the average true range over 14 bars (ATR(14)) is 10 pips, the gap is 1.8 times ATR, a clearly sized imbalance.
How to mark and filter FVGs
- Find three candles with a candle 2 that is large relative to its neighbours.
- Check that the wicks of candle 1 and candle 3 do not overlap. Bodies do not count; the gap is measured wick to wick.
- Measure the gap. Tiny gaps appear all the time and mean little. We only counted gaps of at least 0.3 x ATR(14), where ATR (average true range) is the average candle range of the last 14 bars. Scale the filter to the pair you trade.
- Skip weekend gaps. They come from the market closing, not from fast trading inside a session.
- Draw the rectangle and extend it to the right until it is filled.
You can mark it by hand or with an indicator; the rule matters more than the tool.
CE: the 50% level of the gap
CE (consequent encroachment) is the midpoint of the gap. For the example above that is 1.0859. Traders use it in three ways:
- as a first reaction level, because price that dips into a gap often turns around near the middle;
- as a stop reference: a close beyond the CE against your idea suggests the gap is not holding;
- as a partial target when price is moving the other way from outside the gap.
None of these is a rule. They are conventions that give you a fixed place to define risk in advance.
Filled, partially filled, inverted
- Partially filled: price enters the gap but does not cross the far edge.
- Fully filled: price trades through to the other edge of the gap.
- Inverse FVG (IFVG): price closes through the gap against its original direction. The gap is read as failed, and when price returns to it from the other side, many traders treat it as the opposite kind of zone, for example a failed bullish gap now acting as resistance.
The flip idea is the same as for breaker blocks, which are the order-block version of a failed zone.
BPR in brief
A BPR (balanced price range) is the overlap of a bullish FVG and a bearish FVG that formed in opposite moves over the same prices, so price has crossed the area in both directions. Some traders mark that overlap as a zone where price may react. Treat it as a variation of the same idea, not a separate method.
Our data: how often were FVGs filled?
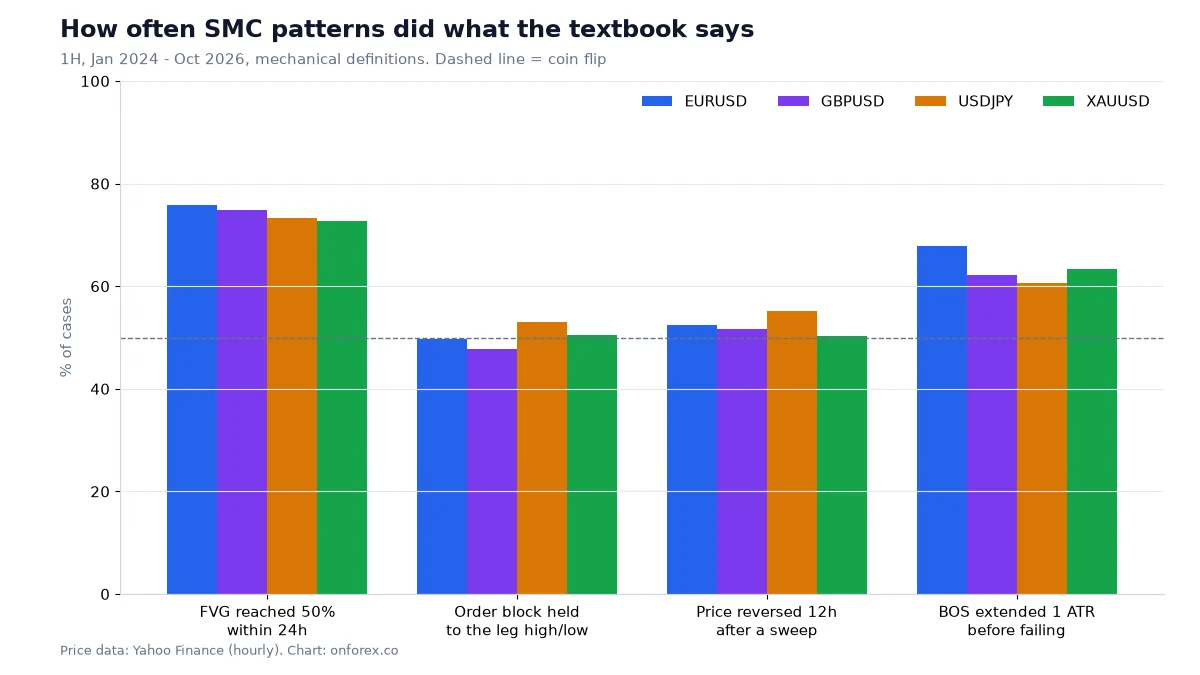
We scanned hourly prices for gaps of at least 0.3 x ATR(14), excluding weekends. Source: OnForex analysis of hourly prices from Yahoo Finance, January 2024 - October 2026 (gold: June 2024 - October 2026, COMEX gold futures).
| EURUSD | GBPUSD | USDJPY | XAUUSD | |
|---|---|---|---|---|
| FVGs found | 2,106 | 2,152 | 1,381 | 1,068 |
| Reached 50% (CE) within 24h | 75.8% | 74.9% | 73.3% | 72.7% |
| Fully filled within 24h | 68.7% | 66.4% | 65.5% | 64.9% |
| Fully filled within 120h | 85.8% | 84.3% | 84.3% | 82.3% |
What to take from it:
- Gaps are revisited often. About three out of four reached their CE within a day, and more than four out of five were filled within five days.
- This is mostly ordinary mean reversion. After a fast candle, price tends to give back part of the move. A gap marks where that happened, so "gap gets filled" is close to "price pulled back", which is common anyway.
- Revisit is not direction. The data counts whether price came back, not whether it then went in your favour. A gap that is revisited and then run through is a filled gap and also a stopped-out trade.
So the honest use of an FVG is as a map of where a pullback is likely to end up, and a reason to wait for price instead of chasing a fast candle. It is not a prediction of the next move.
How traders use FVGs
A typical pattern is to combine gaps with structure: wait for a market structure break, find the gap left by the move, and plan an entry where the gap meets an order block or a discount area (see premium and discount). The stop goes beyond the far edge of the gap with a buffer, and the target is a recent swing or a multiple of the stop. Our guide to the risk-reward ratio covers how to set that multiple.
Two practical points:
- Size the position from the stop. A 12-pip stop with 1% risk on a USD 1,000 account is USD 10 / (12 x USD 10 per pip per lot) = 0.08 lots on EURUSD. Our position sizing guide has the full method.
- Expect worse fills at the wrong time. Gaps form in fast markets, exactly when spreads widen and stops slip. Check trading hours and avoid placing tight stops into major news.
Common mistakes
- Treating every gap as a trade. With 1,000 to 2,000 gaps over almost three years on one pair, you can always find one that fits your story.
- Ignoring size. A 1-pip gap on a 15-pip candle is noise.
- Assuming a fill means reversal. A gap can be filled in the middle of a trend and price may continue anyway.
- Moving the stop once price is inside the gap. Decide before entry what invalidates it, for example a close beyond the far edge.
- Skipping the test. Count outcomes in R for 30 to 50 past gaps before risking money.
Related reading: Smart Money Concepts, liquidity sweep, price action and stop loss.
Practise on a demo account first
Mark structure, FVGs and stops on a free Exness demo account before you risk money. Forex and CFD trading carries a high risk of loss.
Continue to ExnessForex and CFD trading involves significant risk. You may lose your invested capital.
Risk warning: Forex and CFD trading carries a high risk of loss and is not suitable for everyone. You can lose more than you deposit in some cases. Past patterns, including those in this article, do not predict future results. Nothing here is investment advice.
Related Articles
Smart Money Concepts (SMC) Explained: ICT Basics and Our Data
Smart money concepts (SMC) explained: what ICT terms like BOS, order block and FVG mean, how a top-down read works, and what our own price data shows.

ICT Silver Bullet: Times, Rules and What Our Data Shows
The ICT silver bullet strategy: the 10-11 am New York window, the sweep-and-FVG entry, time zone conversions, and our data on what that hour does.
What Is a Pip in Forex? Pip Value Calculator & Examples
Pip definition explained from scratch. How to calculate pip value for major, minor, and exotic pairs. Practical examples with EUR/USD, USD/JPY, GBP/JPY, and more.
Carry Trade in Forex: How Interest Rate Differentials Work
How the forex carry trade works: swap rates, which pairs carry traders watch, why carry trades unwind, and how to judge the risk before you hold a position.
Head and Shoulders Pattern: Neckline, Target and Real Data
Head and shoulders pattern and inverse head and shoulders: neckline, measured move, stop above the right shoulder, and our data on 141 strict cases.
Risk Reward Ratio in Forex: R Multiples, Win Rate and Expectancy
Risk reward ratio explained with R multiples, the break-even win rate table, an expectancy formula with worked examples, and why a higher ratio is not always better.