Premium and Discount in ICT: Dealing Range and OTE
Premium and discount explained: how to mark a dealing range, find equilibrium at 50%, and use the OTE zone (62%, 70.5%, 79%) with a worked example.

This site contains affiliate links. We may earn a commission if you sign up through our links. How we research
Premium and discount is a way of dividing a price range into two halves around its midpoint. The lower half is the discount (relatively cheap) and the upper half is the premium (relatively expensive), and the midpoint is called equilibrium. In ICT and smart money concepts (SMC), traders prefer to look for buys in discount and sells in premium, rather than buying at the top of a range or selling at its bottom.
Disclosure: OnForex may earn a referral commission from Exness links on this page. This is general education, not investment advice.
The dealing range
A dealing range is the stretch of price between the most recent significant swing low and swing high that you choose as your frame. In an uptrend, it runs from the last swing low that caused a break of structure to the high that followed. In a downtrend, it runs from the last swing high to the low.
Choosing the range is the whole skill. Ranges that are too small give noise; ranges that are too big make every pullback look like "discount". Start with the swing that produced your latest break of structure (BOS) or market structure shift (MSS); our market structure guide shows how to mark them.
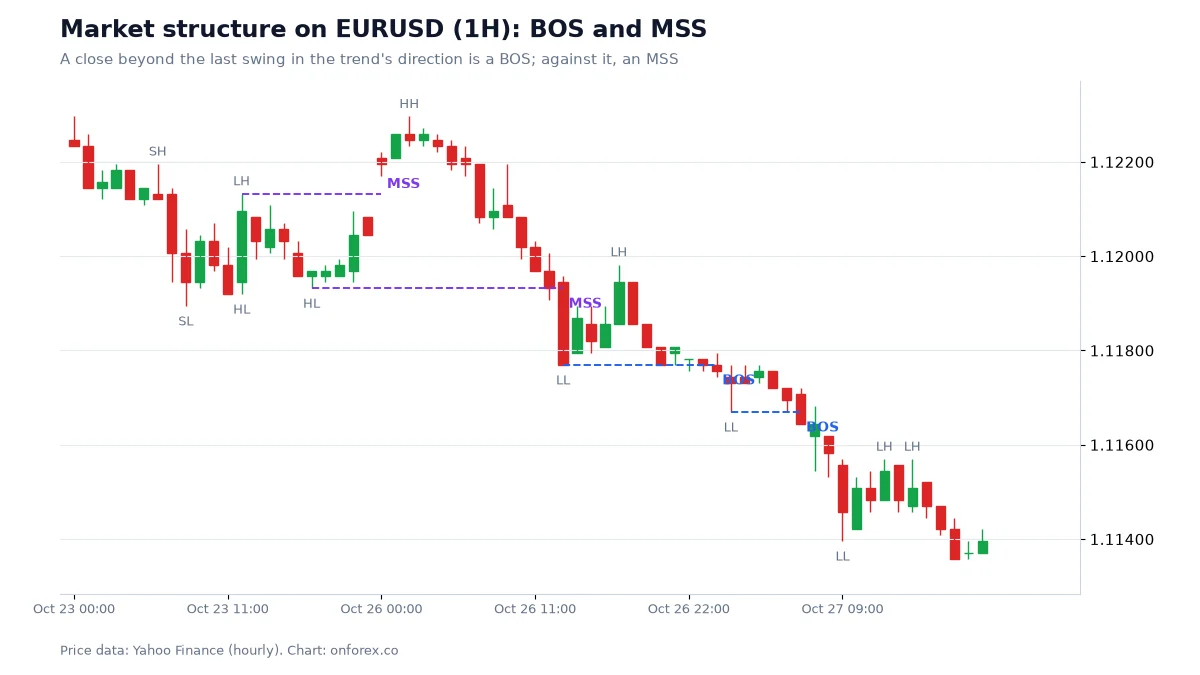
Equilibrium, premium and discount
Once you have the range, divide it:
- Equilibrium (EQ) is 50% of the range, its midpoint. It is the "fair" middle.
- Premium is the area above 50%.
- Discount is the area below 50%.
The logic is positional. If the range is 200 pips tall, a buy at 90% of the range is entered close to the top, so the stop is far away and the room to the target is small. A buy at 30% has the opposite profile. That favourable geometry is what the idea is really about.
Optimal trade entry (OTE): 62%, 70.5%, 79%
OTE (optimal trade entry) is a band inside the deeper half of a pullback: between 62% and 79% retracement of the swing, with 70.5% as its midpoint. It is a Fibonacci-based convention: 62% is rounded from 61.8%, and 79% from 78.6%. Our Fibonacci guide covers the tool and the levels in general.
| Level | Meaning | Use |
|---|---|---|
| 0% | Start of the swing | Anchor |
| 50% | Equilibrium | Divides premium and discount |
| 62% | OTE upper edge | Zone begins |
| 70.5% | OTE midpoint | Often used as a reference |
| 79% | OTE lower edge | Zone ends |
| 100% | End of the swing | Invalidation if closed beyond |
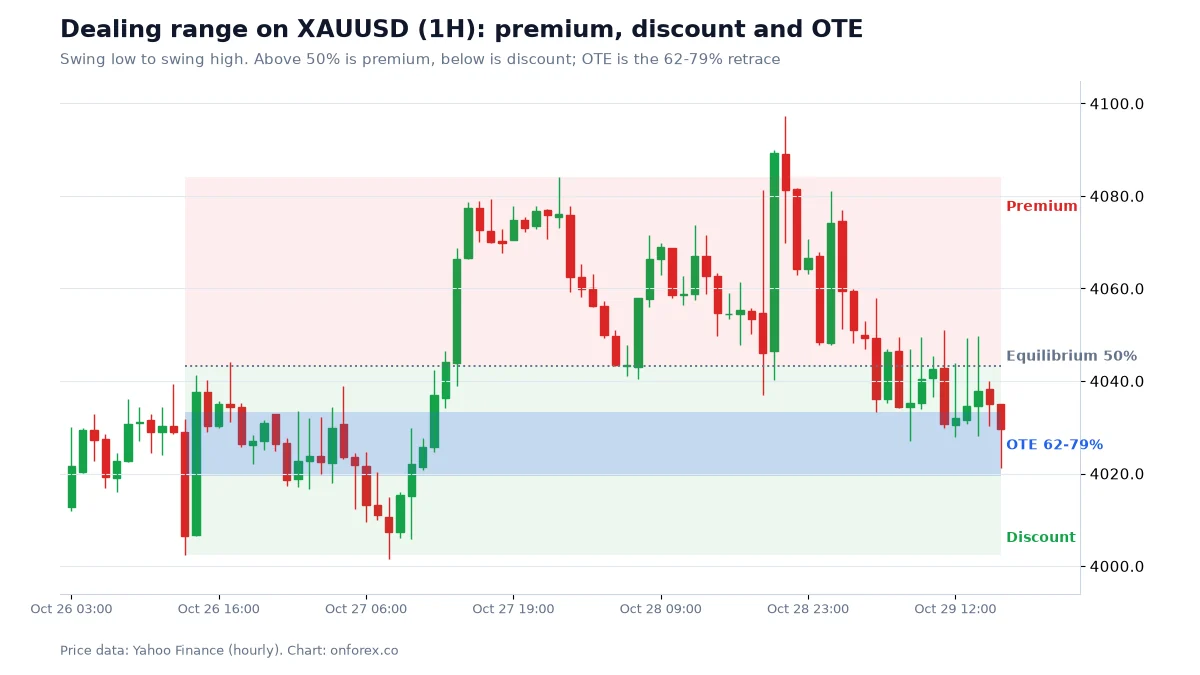
The chart shows gold retracing into the OTE band. One example does not make a rule, and we show our data below to keep things in proportion.
Worked example (illustrative numbers)
Take a bullish swing on EURUSD from a low of 1.1000 to a high of 1.1200. The range is 200 pips.
- Equilibrium: 1.1100
- Premium: 1.1100 to 1.1200
- Discount: 1.1000 to 1.1100
- OTE for a pullback buy, measured down from the high: 62% = 1.1200 - 0.0124 = 1.1076; 70.5% = 1.1200 - 0.0141 = 1.1059; 79% = 1.1200 - 0.0158 = 1.1042
A trader waits for price to retrace into 1.1042-1.1076, then looks for a lower-timeframe sign such as a break of structure, an order block or a fair value gap inside the band. The stop goes below the swing low at 1.1000 (or below the structure that formed the entry), and the target is the swing high at 1.1200. From an entry at 1.1059 and a stop at 1.0990, the risk is 69 pips and the reward 141 pips, about 2R (R is the amount you risk per trade).
At 1% risk on a USD 1,000 account (USD 10) and about USD 10 per pip per standard lot, the size is 10 / (69 x 10) = 0.014 lots. Lot sizes move in steps of 0.01, so you round down to 0.01 lots, which risks about USD 6.90, a little under the 1% budget. The numbers are made up to show the arithmetic, not a trade call. See position sizing and risk-reward ratio.
How to use it step by step
- Identify the trend on a higher timeframe and the swing that broke structure.
- Draw the Fibonacci tool from the swing's start to its end.
- Note equilibrium (50%) and the OTE band (62-79%).
- Wait for price to retrace into discount (for buys) or premium (for sells). If price never retraces, you do not trade; chasing is the thing this framework is trying to avoid.
- Look for confirmation on a lower timeframe: a liquidity sweep, a BOS, an order block or FVG.
- Place the stop beyond the swing, size the position from the stop distance, and set a target at least 1.5R to 2R away. See stop loss placement.
Our data: what we measured and what we did not
Source: OnForex analysis of hourly prices from Yahoo Finance, January 2024 - October 2026 (gold: June 2024 - October 2026, COMEX gold futures).
We did not test premium/discount entries directly, so we will not claim a hit rate for OTE. What we did measure are the pattern types that are often used inside the band:
- Fair value gaps: price reached the 50% midpoint (CE) of the gap within 24 hours in 72.7% to 75.8% of cases across four markets.
- Order blocks: after touching, the block held in 47.7% to 53.1% of cases, which is close to a coin flip.
- Liquidity sweeps: price was on the reversal side 12 hours later in 50.2% to 55.1% of cases.
The takeaway: these are locations to watch, and none of them removes the need for a stop. Premium and discount help you choose where in a range to act; they are not a prediction.
Common mistakes
- Drawing the range from the wrong swing. Different anchors give different levels. Use the swing that broke structure.
- Treating 70.5% as a precise price. It is a zone with a midpoint. Price can overshoot it or turn before it.
- Buying discount in a downtrend. Discount of a bearish range is not a reason to buy against the trend.
- Skipping the stop. A deep pullback that closes beyond 100% invalidates the range.
- Ignoring costs. Spreads widen around news and opens, and stops can fill with slippage, so a narrow OTE entry can cost more than planned.
- Using it on tiny ranges. If the stop is only a few pips, the spread eats a large share of the risk.
Related guides
Premium and discount sit inside the wider smart money concepts toolkit, next to the breaker block and kill zones. For a conventional take on levels, see support and resistance, and for the gold example above see gold trading.
Practise on a demo account first
Mark structure, FVGs and stops on a free Exness demo account before you risk money. Forex and CFD trading carries a high risk of loss.
Continue to ExnessForex and CFD trading involves significant risk. You may lose your invested capital.
Risk warning: Forex and CFD trading carries a high risk of loss and is not suitable for everyone. Retracement zones do not guarantee that price will turn, and past data do not predict future results. Never risk money you cannot afford to lose.
Related Articles

ICT Silver Bullet: Times, Rules and What Our Data Shows
The ICT silver bullet strategy: the 10-11 am New York window, the sweep-and-FVG entry, time zone conversions, and our data on what that hour does.
ICT Kill Zones: London, New York and Asia Times (UTC) With Data
ICT kill zones explained with times in UTC and New York time, how daylight saving shifts them, and our hourly range data for EURUSD, GBPUSD, USDJPY and gold.
Breaker Block: What It Is and How It Differs From an OB
Breaker block explained: how a failed order block becomes a breaker, breaker vs mitigation block vs order block, how to mark one, and the risks of trading it.

Pivot Points in Forex: Formula, Levels and Touch Rates
Pivot points explained: the floor formula with a worked example, Camarilla and Fibonacci pivots, how traders use them, and how often price touched them.
Smart Money Concepts (SMC) Explained: ICT Basics and Our Data
Smart money concepts (SMC) explained: what ICT terms like BOS, order block and FVG mean, how a top-down read works, and what our own price data shows.
Power of Three (AMD): ICT Accumulation, Manipulation, Distribution
ICT Power of Three explained: accumulation, manipulation, distribution, the Judas swing and daily open, with times in UTC and our data on how often it appears.