Smart Money Concepts (SMC) Explained: ICT Basics and Our Data
Smart money concepts (SMC) explained: what ICT terms like BOS, order block and FVG mean, how a top-down read works, and what our own price data shows.
This site contains affiliate links. We may earn a commission if you sign up through our links. How we research
Smart money concepts (SMC) are a vocabulary for describing how price moves: where the trend turns, where stop orders probably sit, and where price tends to come back to. The ideas come mostly from the ICT (Inner Circle Trader) material of Michael Huddleston, and they are popular because they turn a chart into a clear story. They are a way to describe price, not a method that guarantees profit, and our own data below shows why that distinction matters.
Disclosure: OnForex may earn a referral commission from Exness links on this page. This is general education, not investment advice.
This page is the hub for our SMC and ICT series. It explains each core idea in plain language, shows how a top-down read of a chart fits together, and then reports what we measured on four markets. If you only want one takeaway: SMC is useful for being specific about where you would act and where you are wrong, and the evidence for any single pattern being an edge on its own is weak.
What "smart money" means (and what it does not)
The phrase suggests that large institutions leave footprints and that retail traders can follow them. Nobody outside those institutions can see their orders, so every SMC claim about "what banks are doing" is an inference from price, not an observation. That is worth remembering when a video states it as fact.
What you can say honestly is narrower. Large orders need liquidity, meaning many resting orders on the other side. Clusters of stop-losses above recent highs and below recent lows are places where a lot of liquidity sits. SMC gives names to those places and to the footprints that fast moves leave behind. Whether the large players actually behave that way is unproven; the vocabulary is still useful because it forces you to mark levels before you trade.
If you already use classic tools, SMC overlaps with price action and support and resistance. A swing high that stops a rally is a resistance level to one trader and "buy-side liquidity" to another.
The core concepts, one by one
Each concept below has its own guide with a chart, our statistics and common mistakes.
| Concept | One-line meaning | Guide |
|---|---|---|
| Market structure (BOS, MSS, CHoCH) | The sequence of swing highs and lows, and the moment it breaks | Market structure |
| Liquidity and sweeps (BSL, SSL) | Resting stops above highs / below lows, and a wick that takes them | Liquidity sweep |
| Order block (OB) | The last opposite candle before a leg that broke structure | Order block |
| Fair value gap (FVG) | A gap between candle 1 and candle 3 that candle 2 left behind | Fair value gap |
| Premium / discount, equilibrium, OTE | Where price sits inside a range, and the 62-79% retracement band | Premium and discount |
| Breaker block | An order block that failed and is retested from the other side | Breaker block |
| Kill zones | Times of day when ranges are widest | ICT kill zones |
A short definition of each, so this page stands on its own:
- Market structure is the pattern of swing highs and swing lows. Higher highs and higher lows describe an uptrend. A BOS (break of structure) is a close beyond the last swing in the trend direction. An MSS (market structure shift, often called CHoCH) is a close beyond the swing against the trend, which is the first sign of a change.
- Liquidity is the pool of resting orders at obvious levels. BSL (buy-side liquidity) sits above highs, because short sellers' stops and breakout buy orders are there. SSL (sell-side liquidity) sits below lows. A liquidity sweep is a wick that pokes beyond the level and closes back inside.
- Order block: the last down candle before a strong up leg (bullish OB) or the last up candle before a strong down leg (bearish OB). Traders watch for price to return to it.
- Fair value gap (FVG): three candles where the wick of candle 1 and the wick of candle 3 do not overlap. The CE (consequent encroachment) is the 50% midpoint of the gap.
- Dealing range is the swing low to swing high you are working inside. Equilibrium is its 50% level. Above is premium, below is discount, and the OTE (optimal trade entry) is the 62-79% retracement band.
How a top-down read fits together
SMC is usually applied from the big picture to the small one. This is a description of the process, not a recipe for entries.
- Higher timeframe bias (daily / 4H). Mark the last few swing highs and lows. Is structure making higher highs, lower lows, or ranging? Mark the dealing range and its equilibrium.
- Liquidity map. Mark the obvious highs and lows that stops likely sit beyond: yesterday's high and low, equal highs, the range extremes.
- Point of interest (1H). Within the range, note any unmitigated order block or FVG in the area that matches your bias. For a long idea that means discount, for a short idea premium.
- Confirmation (15M-1H). Wait to see whether price reacts: a sweep and reclaim, or an MSS in your direction.
- Plan the risk first. Place the stop beyond the level that proves the idea wrong, then size the position from it. See position sizing and risk management.
- Define the exit. Decide the target in R multiples before entry, for example the next liquidity pool or a fixed 2R.
The order matters because it keeps you from hunting for a pattern and then inventing a reason to trade it. If step 1 does not give a clear bias, the honest answer is no trade.
A worked example from our charts
On the EURUSD 1-hour chart on 28 October 2026 at 14:00 UTC, price had broken structure upward and then pulled back into a bullish order block. A plan built on that: entry 1.11321 at the top of the order block, stop 1.11247 below it with a 0.2 ATR buffer (7.4 pips), target 1.11469 at 2R. The target was reached before the stop. That is one trade; it tells you how the plan is laid out, and nothing about how often it works.
Sizing it on a USD 1,000 account with 1% risk: risk is USD 10, the stop is 7.4 pips, and a standard lot on EURUSD is worth about USD 10 per pip, so 10 / (7.4 x 10) = 0.13 lots. You can check the arithmetic with the pip value and lot size guides.
Our data: do these patterns hold up?
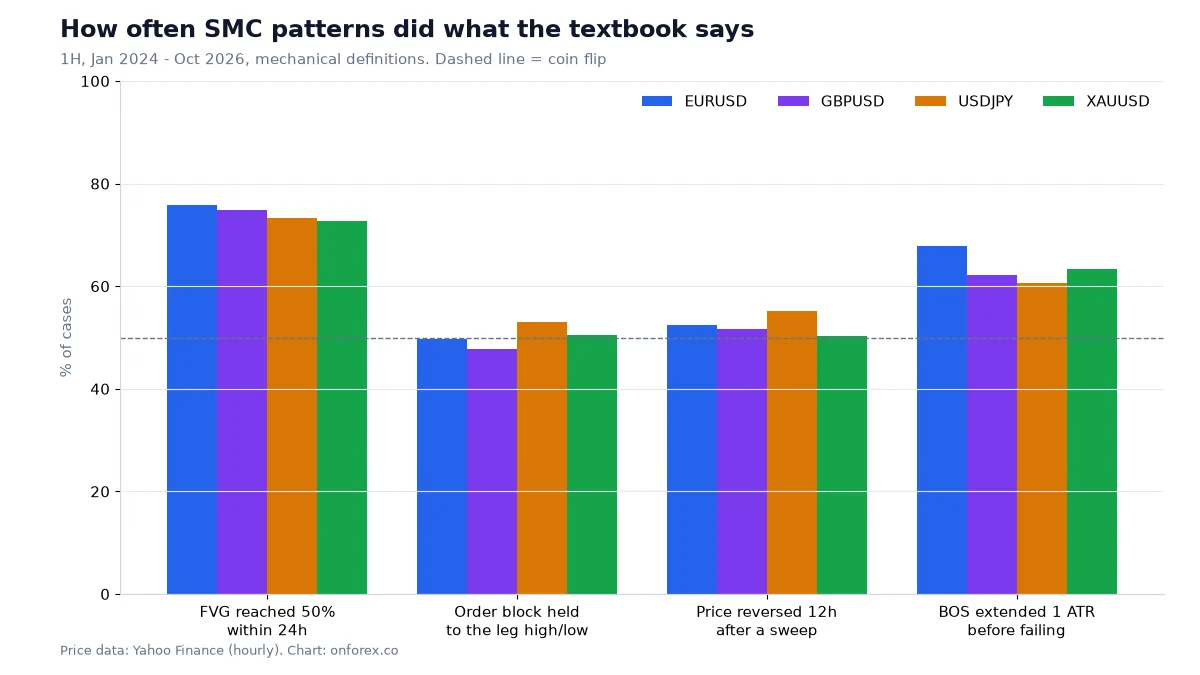
We tested the definitions above on hourly candles. Source: OnForex analysis of hourly prices from Yahoo Finance, January 2024 - October 2026 (gold: June 2024 - October 2026, COMEX gold futures). Swing = highest or lowest of 3 bars each side. FVG = gap between candle 1 and 3 of at least 0.3 x ATR(14), weekend gaps excluded. Order block = last opposite candle before the leg that broke structure.
| EURUSD | GBPUSD | USDJPY | XAUUSD | |
|---|---|---|---|---|
| FVGs found | 2,106 | 2,152 | 1,381 | 1,068 |
| FVG reached its 50% (CE) within 24h | 75.8% | 74.9% | 73.3% | 72.7% |
| Price came back to the order block within 48h | 82.3% | 81.2% | 84.4% | 79.6% |
| Order block held after the touch | 49.7% | 47.7% | 53.1% | 50.4% |
| Liquidity sweeps found | 267 | 322 | 414 | 291 |
| Price 12h later on the reversal side | 52.4% | 51.6% | 55.1% | 50.2% |
| Baseline: any hour, price lower 12h later | 49.8% | 49.0% | 45.8% | 45.5% |
How to read it:
- FVGs and order blocks get revisited often (roughly three in four gaps reach their midpoint within a day; about four in five order blocks are retested within two days). That is mostly ordinary behaviour after a fast move: price overshoots and comes back. It means the levels are useful places to watch, not that something special happens there.
- Holding is a coin flip. After touching the order block, about half held and half closed through it. Sweeps showed price on the reversal side 50-55% of the time, against a baseline of 46-50%, a small tilt that is not enough to trade on alone.
- Structure breaks tend to continue a little. In the same dataset, a BOS or MSS extended a further 1 ATR before closing back through the level about 61-68% of the time, depending on the market.
- Stops need room. A random entry with a 1 ATR stop was hit within 24 hours 73-78% of the time, and a 2 ATR stop still 51-56%. Tight stops "just beyond the block" are often too tight.
These numbers describe our definitions on one data set. Different definitions, timeframes or periods will give different results, and none of this accounts for spread and slippage.
When timing matters: sessions
ICT teaching puts weight on time of day. Average hourly ranges do vary a lot across the day, with the London and New York overlaps the busiest. We cover it, with a chart, in ICT kill zones. Spreads also widen around news releases and market opens, and stop orders can fill beyond your price (slippage) when the market jumps.
Common mistakes
- Marking everything. If every candle is an "order block", none of them mean anything. Mark only levels that come from a clear break of structure.
- Skipping the higher timeframe. A bullish setup in a clear daily downtrend is a counter-trend trade; know that before you take it.
- Treating a pattern as a signal. Our data says the patterns alone are near 50%. The edge, if any, comes from risk placement, targets and selection.
- Using hindsight. On a finished chart every order block looks perfect. Replay the chart bar by bar and mark levels as they would have appeared.
- Oversizing. A great-looking setup does not change the maths. Even with a positive expectancy, a 5% risk per trade produced a median drawdown near 49% in our simulation, against about 12% at 1%.
Where to go next
Start with market structure, then liquidity sweeps, order blocks and fair value gaps. Pair them with stop-loss and risk per trade so each idea comes with a defined risk.
Practise on a demo account first
Mark structure, FVGs and stops on a free Exness demo account before you risk money. Forex and CFD trading carries a high risk of loss.
Continue to ExnessForex and CFD trading involves significant risk. You may lose your invested capital.
Risk warning: Forex and CFD trading carries a high risk of loss, and many retail accounts lose money. Statistics here describe past data under our definitions and do not predict future results. Nothing on this page is investment advice.
Related Articles

Order Block: How to Mark It, Trade It and Test It
Order block explained: bullish and bearish OB, how to mark one step by step, mitigation, valid vs weak blocks, and how often OBs held in our own price data.
Fair Value Gap (FVG): Meaning, Marking and Fill Rates
Fair value gap (FVG) explained: how to spot a three-candle imbalance, the 50% CE level, inverse FVG, BPR, and how often gaps were filled in our own data.
Breaker Block: What It Is and How It Differs From an OB
Breaker block explained: how a failed order block becomes a breaker, breaker vs mitigation block vs order block, how to mark one, and the risks of trading it.

Price Action Trading: How to Read Raw Charts Like a Pro
Learn price action trading from scratch in 2026. Master candlestick patterns, key support and resistance levels, and how to trade forex without lagging indicators.
Supply and Demand Zones: How to Draw, Trade and Test Them
Supply and demand zones explained: base and departure, how to draw a zone step by step, fresh vs tested zones, and how often zones held in our own 4H data.
Forex Candlestick Patterns: 16 Key Patterns and How to Use Them
Forex candlestick patterns in one table: what 16 key patterns show, the confirmation to wait for, entry and stop rules and why patterns alone are weak.