Liquidity Sweep Explained: Stop Hunts, BSL and SSL
What a liquidity sweep is, how buy-side and sell-side liquidity form, how a sweep differs from a breakout, and what 1,294 sweeps in our data showed.
This site contains affiliate links. We may earn a commission if you sign up through our links. How we research
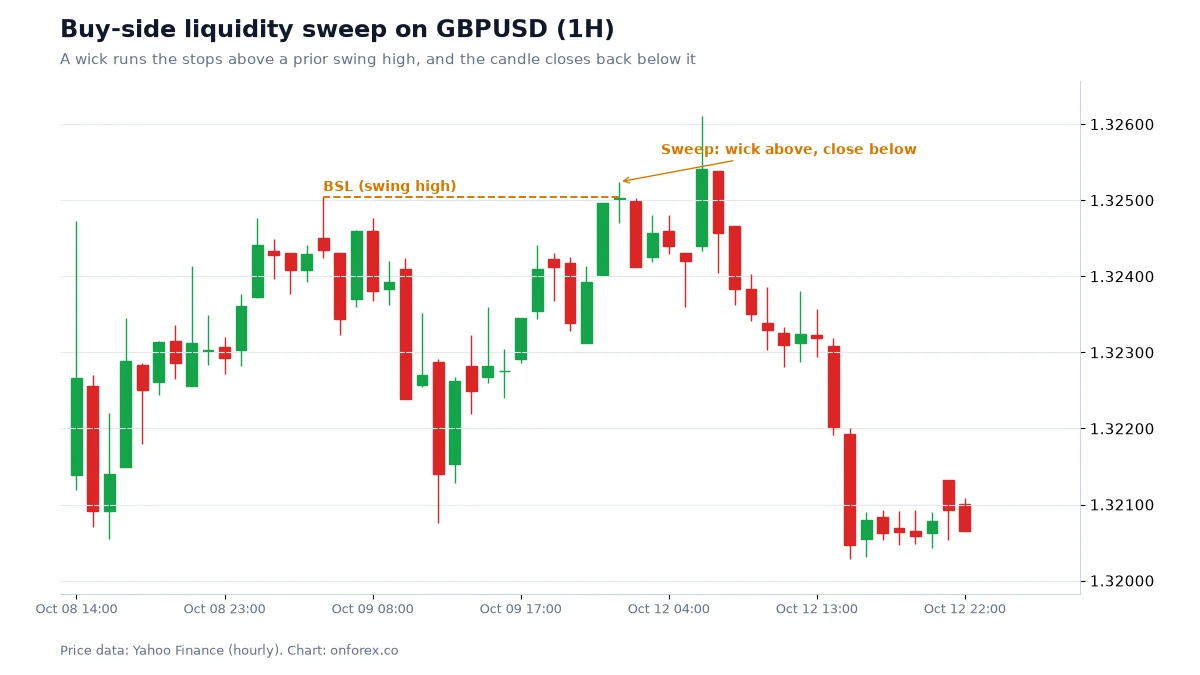
A liquidity sweep is a candle that pokes beyond an obvious swing high or low, triggers the stop orders and breakout orders sitting there, and then closes back inside the previous range. In ICT and smart money concepts (SMC) language, the area being swept is called liquidity, because many orders are waiting at that price. This guide explains how liquidity forms, how to tell a sweep from a breakout, and what our own statistics say about how often sweeps reverse.
Disclosure: OnForex may earn a referral commission from Exness links on this page. This is general education, not investment advice.
What liquidity means in a chart
In this context, liquidity simply means a cluster of resting orders at a price. Every trader who places a stop loss, a pending breakout order or a take profit creates an order at a specific level. Those orders have to be matched by someone on the other side, so a price where lots of orders sit is a price where a fast move is easy to execute.
Where do the clusters form? Mostly at levels the whole market can see:
- Recent swing highs and swing lows (a swing high is the highest bar among, say, three bars on each side; see our market structure guide)
- Equal highs and equal lows, where two or more peaks stop at almost the same price
- The previous day's, week's or session's high and low
- Round numbers such as 1.1000 or 2,000
Buy-side and sell-side liquidity (BSL and SSL)
Think about who has orders where. A trader who is short usually places the stop loss above a recent high. A trader who wants to buy a breakout places a buy stop order above that same high. Both are buy orders that trigger when price trades through the level.
- Buy-side liquidity (BSL) sits above swing highs and equal highs. It is made of short sellers' stops and breakout buy orders.
- Sell-side liquidity (SSL) sits below swing lows and equal lows. It is made of long positions' stops and breakout sell orders.
Equal highs and equal lows are treated as especially "loaded" because several traders have clearly placed the same stop just beyond the same line.
Sweep, stop hunt and breakout: three words, one question
These terms get mixed up, so here is a clean split.
| Term | What the candle does | What it means |
|---|---|---|
| Liquidity sweep | Wicks beyond the level, closes back inside | Orders at the level were triggered, but buyers or sellers did not stay beyond it |
| Breakout | Closes beyond the level and holds | Price accepted the new area |
| Stop hunt | Same shape as a sweep, plus an assumption of intent | A popular label, but intent cannot be seen on a chart |
The honest version: price often spikes through obvious levels because many orders are there, and spreads widen around news and session opens, which can trigger stops. Whether a particular spike was "targeted" cannot be proven from a candlestick. Use "sweep" as a description of what price did, and keep the conspiracy out of your analysis.
The practical difference between a sweep and a breakout is the candle close. Mid-candle, they look identical. That is why most traders who use the idea wait for the close back inside the range before they treat it as a sweep.
Inducement: a smaller sweep on the way
Inducement is the ICT name for a minor liquidity pool that sits in front of a bigger one, such as a small swing low formed during a pullback. The idea is that traders are drawn into early entries and their stops get cleared before the larger move. For your analysis, inducement means one practical thing: do not treat the first obvious level as the only one. Mark the minor and the major pools, and note which one price took.
How to read a sweep step by step
- Mark swing highs and lows on the timeframe you trade, and flag equal highs or lows.
- Decide which side matters. In an uptrend, sell-side sweeps below a low can be a pullback; BSL above a high can be where a rally runs out of fuel.
- Wait for a candle to wick beyond the level.
- Check the close. Closing back inside the range is a sweep; closing beyond is a break.
- Look at what happens next: a break of structure (BOS) or market structure shift (MSS) in the opposite direction adds weight to the idea. A sweep with no follow-through is just a wick.
- Place the stop beyond the sweep wick, not inside it, and size the position from that distance. See stop loss placement and position sizing.
A worked example
Suppose EURUSD has equal highs at 1.0850 after a rally, and the hourly candle makes a high of 1.0862, then closes at 1.0844. That is a 12-pip wick above the level and a close 6 pips inside it. A trader looking for a short sets the stop 3 pips above the wick, at 1.0865, and enters on a break of the last small swing low, say at 1.0838. The risk is 27 pips.
With a USD 1,000 account risking 1% (USD 10), and a pip value of about USD 10 per standard lot on EURUSD, the position is 10 / (27 x 10) = 0.037 lots, which rounds down to 0.03 lots. These numbers are illustrative, not a trade call. The point is that the wick sets the stop distance, and the stop distance sets the size. Spreads and slippage also matter: on a news candle the fill can be worse than the planned price.
Our data: do sweeps reverse?
We tested the idea on hourly prices. A sweep was defined as a wick beyond a swing (highest or lowest of 3 bars each side) that closes back inside.
Source: OnForex analysis of hourly prices from Yahoo Finance, January 2024 - October 2026 (gold: June 2024 - October 2026, COMEX gold futures).
| EURUSD | GBPUSD | USDJPY | XAUUSD | |
|---|---|---|---|---|
| Sweeps found | 267 | 322 | 414 | 291 |
| Price on the reversal side 12h later | 52.4% | 51.6% | 55.1% | 50.2% |
| Baseline: any hour, price lower 12h later | 49.8% | 49.0% | 45.8% | 45.5% |
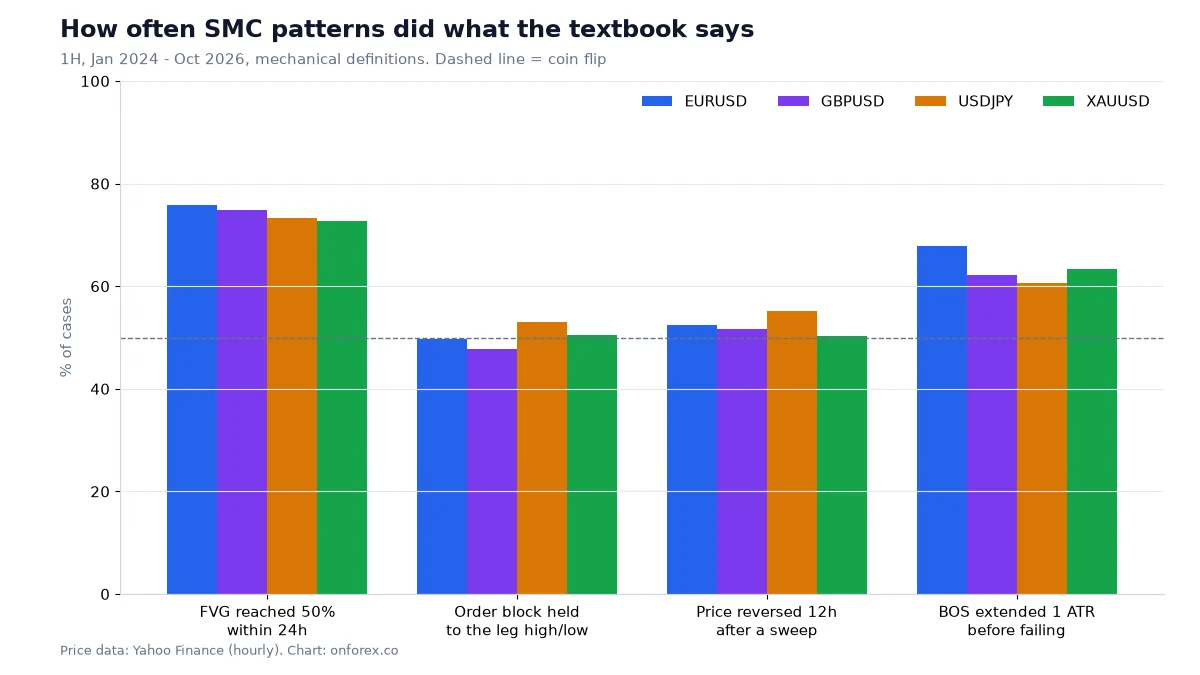
The reversal rate after a sweep was between 50.2% and 55.1%. That is only slightly above a coin flip, and the baseline for "price lower 12 hours later" is itself near 50% (a little lower on USDJPY and gold, which is related to their upward drift over this period). The honest reading is that a sweep did not show a standalone edge in our sample. It is a location where price reacted, sometimes, not a signal to enter on its own. Fair-value gaps and order blocks behaved similarly; see fair value gap and order block.
Common mistakes
- Treating every wick as a sweep. Thousands of wicks form every year. Only the ones beyond obvious, higher-timeframe levels matter.
- Entering at the close of the sweep candle with no plan. There may be a second sweep. Define the stop first.
- Ignoring the trend. A sweep against a strong higher-timeframe trend often just continues.
- Placing the stop inside the wick. The sweep wick is the level price has just shown it will visit.
- Calling every loss a stop hunt. If a stop was tight and the market was noisy, the stop was simply too tight. Test your stops against average ranges, as we do in the stop loss guide.
- Trading right at news or session opens. Spreads widen and fills slip; the same sweep costs more to trade.
How sweeps connect to the rest of SMC
A sweep is rarely used alone. Traders pair it with a break of structure on a lower timeframe, then look for an entry in an order block or fair value gap, and judge whether the entry is in a discount or premium of the range (see premium and discount). The full picture is in our smart money concepts overview. Timing matters too: traders often watch for sweeps near session opens (we did not measure this), so read the kill zones guide. For a classic non-ICT view of the same levels, see support and resistance and price action.
Practise on a demo account first
Mark structure, FVGs and stops on a free Exness demo account before you risk money. Forex and CFD trading carries a high risk of loss.
Continue to ExnessForex and CFD trading involves significant risk. You may lose your invested capital.
Risk warning: Forex and CFD trading carries a high risk of loss and is not suitable for everyone. Patterns such as liquidity sweeps do not guarantee any outcome, and our statistics describe past data only. Never risk money you cannot afford to lose.
Related Articles
Market Structure in Forex: BOS, MSS, CHoCH and Swings Explained
Market structure explained: how to mark HH, HL, LH and LL, tell BOS from MSS and CHoCH, separate internal from swing structure, and use multiple timeframes.

Dow Theory in Forex: The Six Tenets and How to Read Trends
Dow theory explained for forex: the six tenets in plain language, how to define a trend by highs and lows, and where it fits and fails on currency charts.
Forex Order Types: Market, Limit, Stop and OCO Explained
Forex order types explained: market, buy limit, sell limit, buy stop, sell stop, stop loss, take profit, trailing stop, OCO and slippage, with a EURUSD example.
ATR Indicator: Formula, Settings and ATR Stop-Loss in Forex
ATR explained: how Average True Range is calculated with a worked example, the 14-period setting, ATR stops, position sizing and our stop-hit data.
Forex Risk Management: How to Calculate Risk per Trade
Forex risk management step by step: calculate lot size from a 1% risk and a stop-loss, with USD 1,000 and USD 2,000 EUR/USD examples, drawdown and analytics.
Stop Loss in Forex: Where to Place It (ATR, Structure, Pips)
Where to place a forex stop loss: structure-based, ATR-based and fixed-pip stops compared, how stop distance sets lot size, slippage, gaps, trailing and BE.