Dow Theory in Forex: The Six Tenets and How to Read Trends
Dow theory explained for forex: the six tenets in plain language, how to define a trend by highs and lows, and where it fits and fails on currency charts.

This site contains affiliate links. We may earn a commission if you sign up through our links. How we research
Dow theory is a framework for reading trends from the sequence of swing highs and swing lows. An uptrend is a run of higher highs (HH) and higher lows (HL), a downtrend is a run of lower highs (LH) and lower lows (LL), and the trend is assumed to continue until price clearly breaks that pattern. The idea comes from Charles Dow (a short history is on Wikipedia), and it is the oldest layer of technical analysis that forex traders still use.
Disclosure: OnForex may earn a referral commission from Exness links on this page. This is general education, not investment advice.
This page puts the six tenets into plain language, shows how to define a trend with a written rule, and tests where the theory helps on currency charts and where it does not. It builds on market structure, which is the same swing logic with modern labels, and on price action.
Where Dow theory comes from
Charles Dow (1851-1902) co-founded Dow Jones & Company and edited the Wall Street Journal. He wrote editorials about how the stock averages moved, and later writers, notably William Hamilton and Robert Rhea, organised those ideas into what we call Dow theory. The original work was about two US stock averages, not currencies, so every tenet needs translating before it fits spot forex. We say below which ones translate cleanly and which do not.
The six tenets in plain language
Sources count the tenets slightly differently. This is the common six-point version, with what each means on a forex chart.
| # | Tenet | Plain meaning | On a forex chart |
|---|---|---|---|
| 1 | The averages discount everything | Price already contains what the market knows and expects | Price moves on news you did not predict; you read price, not the story |
| 2 | The market has three trends | Primary (months to years), secondary (weeks to months), minor (days to weeks) | Daily/weekly chart = primary, 4H/daily = secondary, 1H and below = minor |
| 3 | Primary trends have three phases | Early positioning, broad participation, late exhaustion | Hard to label in real time; useful for review |
| 4 | The averages must confirm each other | Two indices should make new highs or lows together | Closest analogue: correlated pairs such as EURUSD and GBPUSD agreeing |
| 5 | Volume confirms the trend | Volume should rise with the trend direction | No central volume in spot forex; only broker tick volume |
| 6 | A trend persists until a definite reversal signal | Assume continuation until the structure breaks | The most practical tenet; see the trend definition below |
Tenets 1, 2 and 6 transfer cleanly. Tenet 3 is a story you can only label afterwards. Tenets 4 and 5 are the weak links in forex, and it is better to say so than to pretend a tick-volume bar is the same as exchange volume.
Defining a trend with a written rule
The value of Dow theory is that it turns "this looks like a trend" into a rule two people can apply the same way.
- Pick a swing rule. In our research a swing high is the highest high of 3 bars on each side, and a swing low is the lowest low of 3 bars on each side. Wider windows (5 or 10 bars) give fewer, larger swings.
- Label each swing against the previous one. A swing high above the previous swing high is an HH; below it, an LH. A swing low above the previous swing low is an HL; below it, an LL.
- Call the trend. HH and HL together: uptrend. LH and LL together: downtrend. Mixed or overlapping: range.
- Define the break. Use a candle close, not a wick, beyond the last relevant swing. Wicks that return are often a liquidity sweep.
- Write the invalidation level. In an uptrend, that is the last higher low. A close below it ends the "all HH/HL" description.
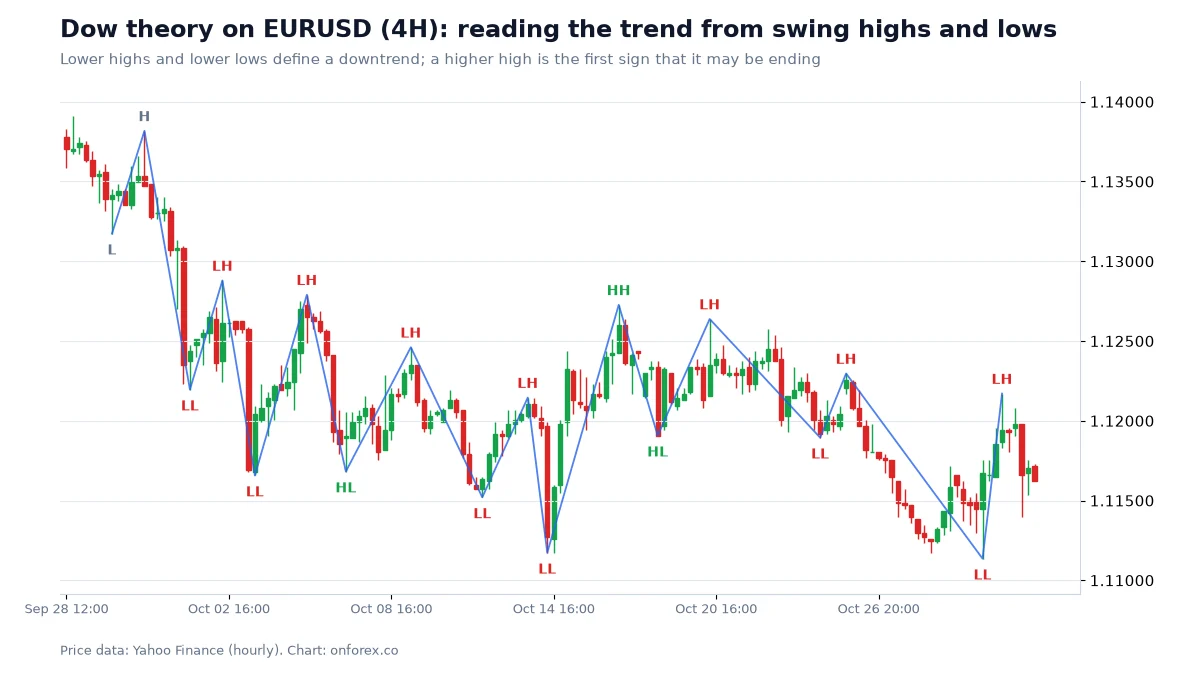
On the chart, the pair prints a run of lower highs and lower lows. At one point price makes a higher low and then a higher high, which looks like a reversal. It does not hold: the next swing high comes in below it and the lows resume. Under a strict reading of Dow theory, the first HL/HH attempt is a warning, not a confirmed trend change, and the downtrend description is only retired when price closes above the last lower high and then holds a higher low. That one example is also why the rule needs a written definition: without it, it is easy to call the reversal early on Monday and late on Friday.
Three trends at once
Tenet 2 is the part most worth using. A chart always contains trends at several scales, and they can point in different directions.
- A primary trend is the big direction, visible on the daily or weekly chart.
- A secondary trend is a correction against it, visible on the 4-hour or daily chart.
- A minor trend is the short-term swing inside the correction, visible on 1-hour and below.
A short-term uptrend inside a daily downtrend is, in Dow terms, a secondary reaction, not a new primary trend. That is why traders who use trend trading check the higher timeframe first, then look for entries in the direction of the larger trend after a pullback. The lower timeframe gives the timing, the higher one the context. Note what this does not claim: it does not say the primary trend must resume, only that the lower-timeframe move has not yet changed the larger description.
Confirmation and volume in forex
Dow originally wanted two averages (industrials and rails) to agree. In forex there are no such averages, but two substitutes are common:
- Related pairs. If EURUSD makes a new low and GBPUSD does too, the US dollar move is more broadly based than if only one pair does. This is useful but not exact, because the pairs are driven by different non-dollar currencies as well (see correlation).
- Tick volume. MT4 and MT5 show the number of price changes per bar, which broadly tracks activity but is not the number of lots traded. Treat it as a rough activity gauge, not as proof.
Neither is a reason to ignore a trend. They are extra evidence of uneven quality, and an honest write-up of a trade should say which one was used.
What our data says about trend continuation
Dow theory's sixth tenet says to assume continuation until a clear reversal signal. We can check how much weight a break of structure carries. Using the same swing rule on hourly data, we measured how often a close beyond the last swing in the trend direction (a BOS, break of structure) went on to extend by at least 1 ATR (average true range, the typical hourly range over 14 bars) before price closed back through the level.
| EURUSD | GBPUSD | USDJPY | XAUUSD | |
|---|---|---|---|---|
| BOS extended a further 1 ATR before closing back through the level | 67.8% | 62.2% | 60.7% | 63.3% |
| MSS (break against the trend) extended 1 ATR the same way | 67.5% | 61.2% | 62.1% | 63.9% |
Source: OnForex analysis of hourly prices from Yahoo Finance, January 2024 - October 2026 (gold: June 2024 - October 2026, COMEX gold futures). Swing = highest/lowest of 3 bars each side.
About six or seven times in ten, a close beyond a swing carried on by at least one ATR before it fell back through the level. That is better than a coin flip, so the "assume continuation" tenet has some support in these samples. It also means roughly one break in three failed to follow through by that measure. Dow-style trend calls are descriptions with a modest tilt, not guarantees. Because stops are placed around the same noise, the ATR indicator is the usual way to size the distance.
A worked example: reading the trend, then planning the risk
Suppose EURUSD is in a daily downtrend and the 4-hour chart is making lower highs. A trader using Dow's framework might write:
- Primary trend: down (daily LH/LL).
- Secondary trend: a rally on the 4-hour chart that has not yet closed above the last daily lower high.
- Invalidation: a 4-hour close above the last lower high.
- Plan: only look for short setups in the direction of the primary trend, with the stop beyond the invalidation level.
If the entry is 1.1090 and the invalidation point plus a small buffer is 1.1127, the stop distance is 37 pips. Risking 1% of a USD 1,000 account (USD 10) at USD 10 per pip per standard lot gives 10 / (37 x 10) = 0.027 lots, which most brokers round to 0.02 or 0.03. The numbers are illustrative. They show that the structure supplies the stop and the stop supplies the size, which is how lot size and position sizing connect to a trend description. Stops can fill beyond the level when spreads widen or price gaps around news, so allow for slippage.
Common mistakes
- Calling a reversal on one HL or LH. A single higher low in a downtrend is a warning. Wait for the break and the follow-up swing.
- Mixing timeframes. Labelling 1-hour swings as part of a daily trend produces contradictions. Name the timeframe in every statement.
- Treating a wick as a break. Use closes, or decide a wick rule in advance.
- Skipping the written rule. Changing the swing window after the market moves is hindsight.
- Copying the volume tenet. Tick volume is not exchange volume.
- Forgetting that trends end. Tenet 6 says "until a definite signal", which means you still need an exit plan. See stop loss and risk-reward ratio.
Where to go next
If you can label swings consistently, the next steps are market structure (BOS, MSS and CHoCH on top of the same swings), support and resistance (the levels swings leave behind), and moving averages (a smoothed view of the same trend). For the wider toolkit, see strategies.
Practise on a demo account first
Mark swings, trends and stops on a free Exness demo account before you risk money. Forex and CFD trading carries a high risk of loss.
Continue to ExnessForex and CFD trading involves significant risk. You may lose your invested capital.
Risk warning: Forex and CFD trading carries a high risk of loss, and many retail accounts lose money. Statistics here describe past data under our definitions and do not predict future results. Nothing on this page is investment advice.
Related Articles

Market Structure in Forex: BOS, MSS, CHoCH and Swings Explained
Market structure explained: how to mark HH, HL, LH and LL, tell BOS from MSS and CHoCH, separate internal from swing structure, and use multiple timeframes.

Liquidity Sweep Explained: Stop Hunts, BSL and SSL
What a liquidity sweep is, how buy-side and sell-side liquidity form, how a sweep differs from a breakout, and what 1,294 sweeps in our data showed.

Pullback Trading: Buy Dips and Sell Rallies in a Trend
Pullback trading explained: EMA, Fibonacci and structure pullbacks, telling a dip from a reversal, a worked example, and what our 4-hour data showed.

Multiple Time Frame Analysis: Top-Down Analysis in Forex
Multiple time frame analysis explained: how top-down analysis works, which timeframes to combine, a step-by-step routine, and what our trend data showed.

Forex Trading Strategies: A Practical Guide (2026)
Trend following, range trading, scalping, swing trading and carry trades explained with entry and exit rules, risk management and how to test a strategy.
ADX Indicator: Settings, +DI/-DI and What Our Data Shows
ADX indicator guide: how ADX and +DI/-DI are calculated, what 20, 25 and 40 mean, how to use ADX to pick a method, and what our data shows on four markets.