ADX Indicator: Settings, +DI/-DI and What Our Data Shows
ADX indicator guide: how ADX and +DI/-DI are calculated, what 20, 25 and 40 mean, how to use ADX to pick a method, and what our data shows on four markets.
This site contains affiliate links. We may earn a commission if you sign up through our links. How we research
The ADX indicator (Average Directional Index) measures how strong a trend is on a scale from 0 to 100, without telling you whether it is up or down. J. Welles Wilder introduced it in 1978, the default period is 14, and readings above 25 are usually read as a trending market and below 20 as a weak or ranging one. In our test on four markets, a high ADX described a strong move that had already happened but did not predict that the next 20 four-hour bars would continue it, so the practical use is to choose between trend and range tactics, not to enter trades.
Disclosure: OnForex may earn a referral commission from Exness links on this page. This is general education, not investment advice.
What ADX measures
ADX answers "how strong is the trend?", not "which way is it going?". A fast fall and a fast rise can show the same high ADX. Direction comes from two companion lines, +DI (positive directional indicator) and -DI (negative directional indicator). The three lines together are often called the DMI (Directional Movement Index) system, and many platforms plot them in one panel.
- +DI above -DI: upward movement is stronger than downward movement.
- -DI above +DI: downward movement is stronger.
- ADX: how far apart the two are over time, smoothed. It rises when one side clearly dominates and falls when they are close to equal.
How ADX is calculated
The maths looks heavy, but each step is simple. Everything uses Wilder's smoothing over 14 bars.
- Directional movement. Compare each bar with the previous bar. +DM is today's high minus yesterday's high, if that is larger than yesterday's low minus today's low and above zero. -DM is yesterday's low minus today's low, under the mirror conditions. Otherwise the value is zero.
- True range (TR) is the largest of: high minus low; the absolute value of high minus the previous close; the absolute value of low minus the previous close. The smoothed average of TR is the ATR (see our ATR guide).
- +DI = 100 x smoothed +DM / ATR. -DI = 100 x smoothed -DM / ATR.
- DX = 100 x |+DI - -DI| / (+DI + -DI).
- ADX = the smoothed (14-bar) average of DX.
A calculation with numbers
If +DI is 12 and -DI is 36 on a gold chart, DX = 100 x |12 - 36| / (12 + 36) = 100 x 24 / 48 = 50. If +DI and -DI were both 24, DX would be 0. ADX is then the smoothed average of such DX values, so it moves slowly and lags: it confirms a trend after it has begun.
ADX levels
| ADX reading | Common description |
|---|---|
| Below 20 | Weak trend or a range |
| 20 to 25 | Grey zone, trend may be starting or fading |
| 25 to 40 | Trending |
| Above 40 | Very strong trend (readings above 50 are rare) |
These levels are conventions, not laws. Wilder used 25 as a reference, and many platforms draw a line there. Two more points matter:
- The slope matters as much as the level. A rising ADX means the trend is strengthening; a falling ADX means it is weakening, even if the reading is still high.
- A peak is not a reversal. ADX turning down from a high level usually means the move is slowing, which can be a pause, a pullback or a turn.
ADX indicator settings
The default is 14 periods, with a line at 25 (or lines at 20 and 25). On MT4 and MT5 it is called "Average Directional Movement Index"; TradingView calls it "Average Directional Index" or "DMI".
| Period | Character |
|---|---|
| 7 to 10 | Fast, noisier, ADX moves around 25 often |
| 14 | Wilder's default |
| 20 or more | Smoother and later; fewer false starts |
Shorter periods give more threshold crossings; longer ones give fewer and later ones. As with every indicator, if you change the number, test it on past data first (see our backtesting guide).
Reading the chart
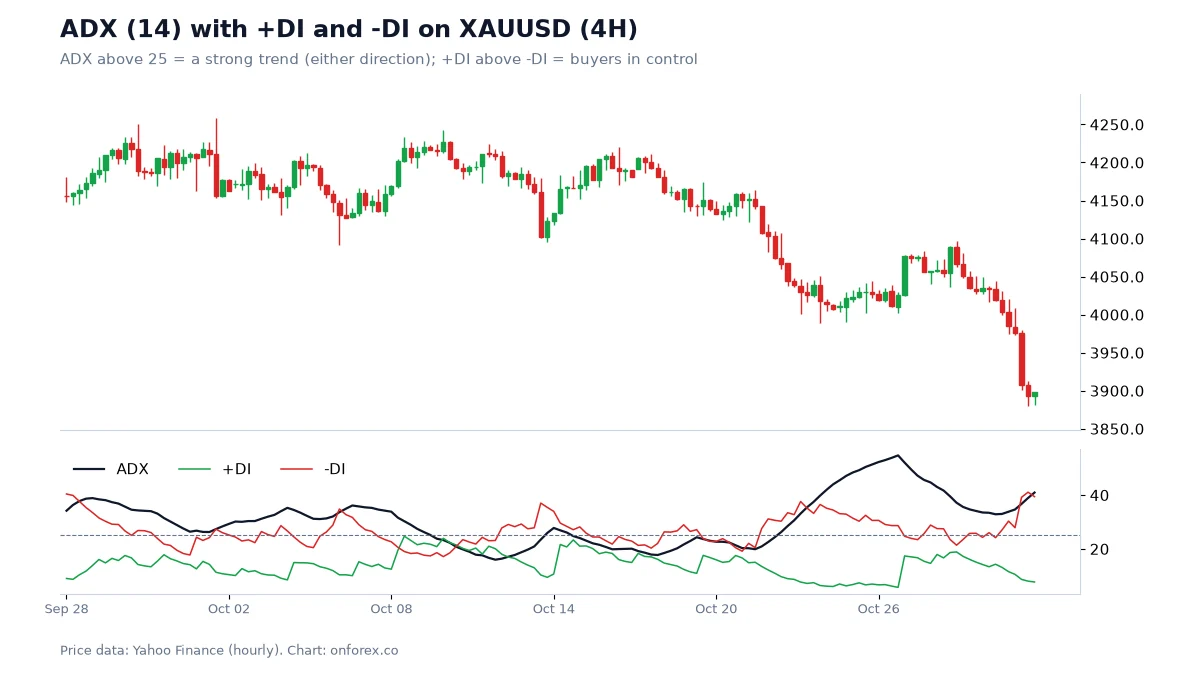
On this gold chart, ADX sits mostly between about 17 and 38 through early and mid October, while price swings between about 4,100 and 4,250. That is a ranging market and, as expected, ADX is low and +DI and -DI keep crossing each other.
From 21 October the picture changes. -DI jumps to about 35 and +DI falls to about 7, ADX climbs from roughly 20 to roughly 52 on 26 October, and price falls from about 4,150 to about 4,030 over those days. That is the textbook description of a strong downtrend.
Then comes the part that matters. ADX peaks on 26 October and turns down, price bounces to about 4,095 and ADX drifts toward 33. A trader who read "ADX falling" as "the trend is over" would have been wrong: price made new lows below 3,900 by 30 October, and ADX climbed back toward 41. ADX described the strength of what had already happened; it did not say what came next.
Our data: does a high ADX predict continuation?
We tested a simple version of the standard claim. On 4-hour charts we compared the direction of the previous 20-bar move with the direction of the next 20-bar move, split by the ADX reading at the time. If a high ADX meant "the trend continues", the share of continuations after ADX above 25 should be clearly above 50%, and above the share after ADX below 20.
Source: OnForex analysis of hourly prices from Yahoo Finance, January 2024 - October 2026 (gold: June 2024 - October 2026, COMEX gold futures). 4H bars are resampled from hourly data. Spreads and slippage are not included.
| EURUSD | GBPUSD | USDJPY | XAUUSD | |
|---|---|---|---|---|
| Share of 4H bars with ADX above 25 | 48.4% | 46.8% | 38.7% | 54.7% |
| Next 20-bar move in the same direction as the previous 20-bar move, ADX above 25 | 49.1% (n=424) | 52.8% (n=411) | 47.5% (n=343) | 44.7% (n=398) |
| Same measure, ADX below 20 | 49.1% (n=277) | 41.8% (n=292) | 54.3% (n=315) | 53.9% (n=204) |
How to read these numbers
- A high ADX did not predict continuation. After ADX above 25 the share was 44.7% to 52.8%, around or slightly below a coin flip. On gold, which trended up over the period, continuation after a high ADX was 44.7%, below 50%.
- There is no consistent gap between high and low ADX. GBPUSD was better with high ADX and USDJPY and gold were better with low ADX. With 200 to 420 cases per cell and eight cells, differences of a few points are noise, and even the 11-point GBPUSD gap deserves caution.
- The likely reason is that strong moves are followed by pullbacks. ADX is high after a big move, and the market often gives part of it back before going on. That is a different statement from "trends do not exist".
- Markets spend a lot of time trending, by this definition. ADX was above 25 on 38.7% to 54.7% of 4H bars, so "above 25" is not rare and cannot be an entry signal on its own.
The honest conclusion: use ADX to describe the market you are in. We did not test combined rules such as "ADX above 25 plus a pullback to a moving average", and nothing here shows that such a rule has an edge.
How traders use ADX
1. Choose the method before the entry
The most defensible use is a switch. ADX below 20: expect a range, so breakout entries fail often and level-to-level trades make more sense. ADX above 25 and rising: expect a trend, so fading every move is dangerous and pullback entries with the trend are the usual choice. See trend trading, support and resistance and breakout strategy.
2. Do not fade a strong move
When ADX is above 40 and one DI line is far above the other, as on the gold chart after 21 October, trying to pick the bottom meant buying into a decline that went further. A high ADX is a warning against counter-trend trades, not a sell signal.
3. +DI / -DI crossovers
A DI crossover is when +DI crosses above -DI (a bullish crossover) or below it (a bearish one). On the gold chart, +DI and -DI cross many times in the quiet October ranging phase, and each cross would have been a false start. The common fix is a filter: take a DI crossover only when ADX is above 20 or 25 and rising.
4. A turn up from a low ADX
ADX rising from below 20 can mark a market waking up after a quiet phase. It is more useful as an alert to look at the chart than as an entry, because it does not tell you the direction. Pair it with a squeeze in Bollinger Bands or a break of structure (market structure).
Worked example: using ADX as a method switch
Suppose EURUSD 4H shows ADX at 17 for two days, with price moving between 1.1580 and 1.1640. You decide it is a range. Then ADX rises through 22 to 28 as price breaks above 1.1640 and +DI moves well above -DI.
- ADX tells you the method has changed from range to trend, so you stop fading the top of the range.
- You wait for a pullback toward the broken level (for example 1.1645) rather than chasing the breakout.
- The stop goes beyond the pullback low, say 25 pips from entry.
- Risk 1% of a USD 1,000 account = USD 10. At about USD 10 per pip per standard lot, size = 10 / (25 x 10) = 0.04 lots.
- If price falls back into the range and ADX drops under 20, the idea is wrong and you exit.
Prices and sizes are illustrative. Spreads widen around news and rollover, and stops can fill with slippage. See position sizing and stop loss.
ADX vs moving averages and Parabolic SAR
| ADX | Moving average | Parabolic SAR | |
|---|---|---|---|
| Answers | How strong is the trend? | Which way is the trend and where is the average? | Where could a trailing stop sit? |
| Direction | Only via +DI / -DI | Slope and price position | Dots above or below price |
| Typical use | Choose trend or range method | Trend filter, dynamic levels | Trailing exit |
They work well as a set: a moving average for direction, ADX for strength, Parabolic SAR or a trailing stop for exits. Read our moving averages guide and Parabolic SAR guide.
Common mistakes
- Treating ADX as a buy or sell signal. It has no direction.
- Reading a falling ADX as a reversal. It means weakening strength; the gold example made new lows after ADX peaked.
- Entering because ADX crossed 25. ADX is late and above 25 on roughly 40 to 55% of bars in our data.
- Trading DI crossovers in a range. They flip constantly when ADX is low.
- Ignoring the stop. Every idea needs a price where it is wrong, and the size comes from that distance.
- Forgetting costs. Spreads and slippage matter more on short timeframes where ADX moves around 25 often.
Related guides
For the wider picture, read our technical analysis guide, then RSI, MACD, the stochastic oscillator, multi-timeframe analysis and our list of forex strategies.
Practise on a demo account first
Mark structure, FVGs and stops on a free Exness demo account before you risk money. Forex and CFD trading carries a high risk of loss.
Continue to ExnessForex and CFD trading involves significant risk. You may lose your invested capital.
Risk warning: Forex and CFD trading carries a high risk of loss and is not suitable for everyone. Indicators describe past prices and do not predict future moves. Past test results do not guarantee future results. Never risk money you cannot afford to lose.
Related Articles
Moving Averages in Forex: SMA, EMA, 200-Day Data
Moving averages in forex: SMA vs EMA formulas, 50/200 golden and death crosses, common periods, and what 9 years of daily data show about the 200-day line.
RSI Indicator: Settings, Strategies and What Our Data Shows
RSI indicator guide: Wilder's formula, the 14 setting, overbought and oversold levels and divergence, with tests on four markets of what RSI can do.
ATR Indicator: Formula, Settings and ATR Stop-Loss in Forex
ATR explained: how Average True Range is calculated with a worked example, the 14-period setting, ATR stops, position sizing and our stop-hit data.
Parabolic SAR: Settings, Formula and Backtest Results
Parabolic SAR explained: the formula, 0.02 / 0.2 settings, how to read the dots, why it whipsaws, and what a flip-every-signal test showed on four markets.
Pullback Trading: Buy Dips and Sell Rallies in a Trend
Pullback trading explained: EMA, Fibonacci and structure pullbacks, telling a dip from a reversal, a worked example, and what our 4-hour data showed.
Bollinger Bands: Settings, Squeeze and What the Data Shows
Bollinger Bands explained: the 20/2 formula, %B and bandwidth, the squeeze, walking the bands and a W-bottom, with hit rates from our own hourly forex data.