Stochastic Oscillator: Settings, Formula and What Our Data Shows
How the stochastic oscillator works: the %K and %D formula, 14,3,3 settings, fast vs slow vs full, overbought and oversold crosses tested on four markets.
This site contains affiliate links. We may earn a commission if you sign up through our links. How we research
The stochastic oscillator is a momentum indicator that shows where the latest closing price sits within the high-low range of the last N bars, on a scale of 0 to 100. Readings above 80 are usually called overbought and below 20 oversold, and the default setting on most platforms is the slow stochastic 14, 3, 3. In our test across four markets, the classic overbought and oversold crosses did not beat a simple baseline on 1-hour charts, so this guide shows how to read the indicator as context rather than as a signal.
Disclosure: OnForex may earn a referral commission from Exness links on this page. This is general education, not investment advice.
How the stochastic is calculated
The indicator has two lines, %K and %D.
- Raw %K = (close - lowest low of the last 14 bars) / (highest high of the last 14 bars - lowest low of the last 14 bars) x 100
- Slow %K = 3-period simple moving average (SMA) of raw %K
- %D = 3-period SMA of slow %K
A simple moving average is the plain average of the last N values. %D is therefore a smoothed version of %K, and crosses between the two are what most traders watch.
A quick calculation
Assume that over the last 14 hourly bars the highest high on GBPUSD is 1.3430, the lowest low is 1.3280, and the latest close is 1.3400.
Raw %K = (1.3400 - 1.3280) / (1.3430 - 1.3280) x 100 = 0.0120 / 0.0150 x 100 = 80
The close sits 80% of the way up the 14-bar range. That is all the indicator says: it describes where price closed, not where it will go.
Stochastic indicator settings
On MT4, MT5 and TradingView the stochastic takes three inputs: the %K period (lookback), the %K slowing and the %D period. They are usually shown as 14, 3, 3.
| Version | %K | %D | Character |
|---|---|---|---|
| Fast stochastic | Raw %K (no smoothing) | 3-period SMA of raw %K | Very sensitive, many crosses |
| Slow stochastic (14, 3, 3) | 3-period SMA of raw %K | 3-period SMA of slow %K | The common default; fewer, smoother crosses |
| Full stochastic | Smoothing you choose | Period you choose | Lets you set all three values, e.g. 14, 5, 5 |
How changing the inputs affects behaviour:
- Shorter lookback (5 to 9): reacts faster, reaches 0 and 100 more often, more crosses and more false ones.
- Longer lookback (21 or more): smoother, fewer extremes, signals come later.
- More slowing (5 instead of 3): smoother lines with a delay.
- Thresholds: 80/20 is common; some use 70/30. Wider thresholds give fewer, more extreme readings.
There is no setting that is "correct" for all pairs and timeframes. If you change it, test the change on past charts first. Our backtesting guide explains how to avoid picking the setting that merely fitted the past best.
Reading the chart
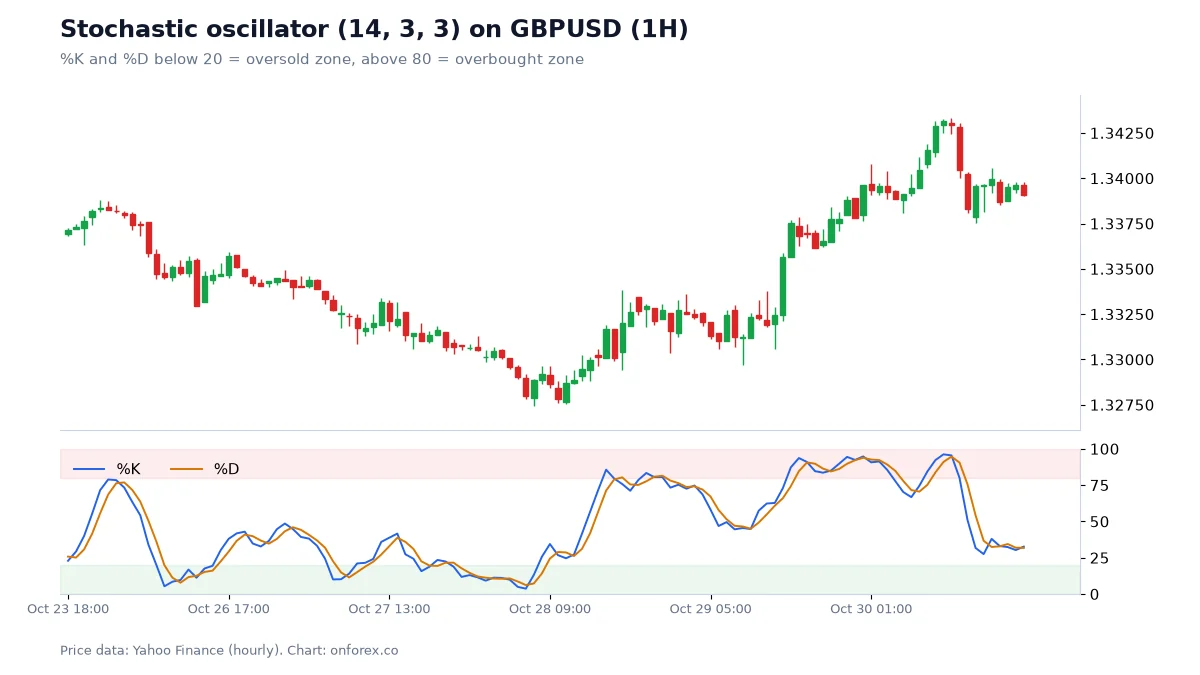
This week on GBPUSD shows the main lesson. From 26 to 28 October price fell from about 1.3385 to about 1.3277, and the stochastic spent long stretches below 20. Several oversold crosses appeared during that fall, and buying the first ones would have meant buying into a continuing decline. Then from 28 to 30 October price climbed towards 1.3430, and the lines stayed above 80 for most of the move. Selling the first overbought cross would have meant selling into a rally.
An extreme reading means price is closing near the edge of its recent range. In a trend, that is the normal state, not a sign of exhaustion.
Our data: do overbought and oversold crosses work?
We tested the textbook signal on the slow stochastic 14, 3, 3.
- Bullish signal: %K crosses above %D while both are below 20. Outcome: was price higher 24 bars later?
- Bearish signal: %K crosses below %D while both are above 80. Outcome: was price lower 24 bars later?
- Baseline: the share of all bars where price was higher (or lower) 24 bars later, with no signal at all.
Source: OnForex analysis of hourly prices from Yahoo Finance, January 2024 - October 2026 (gold: COMEX gold futures from June 2024). 4H bars are resampled from hourly data.
1-hour charts (24 bars = 1 day)
| Market | Oversold cross: higher 24h later | Baseline higher | Overbought cross: lower 24h later | Baseline lower |
|---|---|---|---|---|
| EURUSD | 49.7% (n=597) | 47.7% | 49.2% (n=561) | 52.3% |
| GBPUSD | 52.1% (n=574) | 51.5% | 46.7% (n=613) | 48.5% |
| USDJPY | 54.4% (n=395) | 56.5% | 47.1% (n=782) | 43.5% |
| XAUUSD | 51.3% (n=308) | 53.8% | 43.9% (n=597) | 46.2% |
4-hour charts (24 bars = 4 days)
| Market | Oversold cross: higher later | Overbought cross: lower later |
|---|---|---|
| EURUSD | 48.7% (n=150) | 61.5% (n=135) |
| GBPUSD | 53.1% (n=143) | 50.3% (n=157) |
| USDJPY | 61.1% (n=90) | 49.8% (n=227) |
| XAUUSD | 57.6% (n=85) | 49.1% (n=173) |
How to read these numbers
- On 1-hour charts the crosses were no better than the baseline. The oversold cross beat the baseline by 0.6 to 2.0 points on EURUSD and GBPUSD and trailed it by 2.1 to 2.5 points on USDJPY and gold. The overbought cross trailed its baseline in three of four markets; USDJPY was the exception (+3.6 points).
- A few 4-hour cells look good, but that is what chance produces. EURUSD overbought at 61.5% and USDJPY oversold at 61.1% stand out. With only 90 to 230 cases per cell and 16 cells tested across both timeframes, a couple of cells far from 50% is expected even if the signal has no value. The neighbouring cells sit near 50%.
- Trends change the signal count. USDJPY rose for much of the period, so it produced 782 overbought crosses but only 395 oversold ones on 1-hour charts (227 vs 90 on 4-hour). The indicator mostly told us that the market was trending.
- No costs are included. Spreads and slippage would lower all of these figures.
The honest conclusion: a stochastic cross at an extreme is not a signal on its own. It can still be useful as a timing tool once you already have a reason to trade, such as a trend and a location.
Ways traders use the stochastic
1. With a trend filter
Decide the trend first, for example with the 50 EMA or market structure, and only take stochastic crosses in that direction. In an uptrend, a cross up from below 20 during a pullback is a timing cue for a long; overbought readings are ignored rather than sold. Our pullback trading guide and moving averages guide explain how to define the trend.
2. At a level you already marked
A cross matters more when it appears at a level that has a reason to hold, such as support and resistance, a supply and demand zone or a Fibonacci retracement. The stochastic is the trigger; the level is the reason.
3. Divergence
A bearish divergence is a higher high in price with a lower high in the stochastic; a bullish divergence is a lower low in price with a higher low in the indicator. The idea is that momentum is fading.
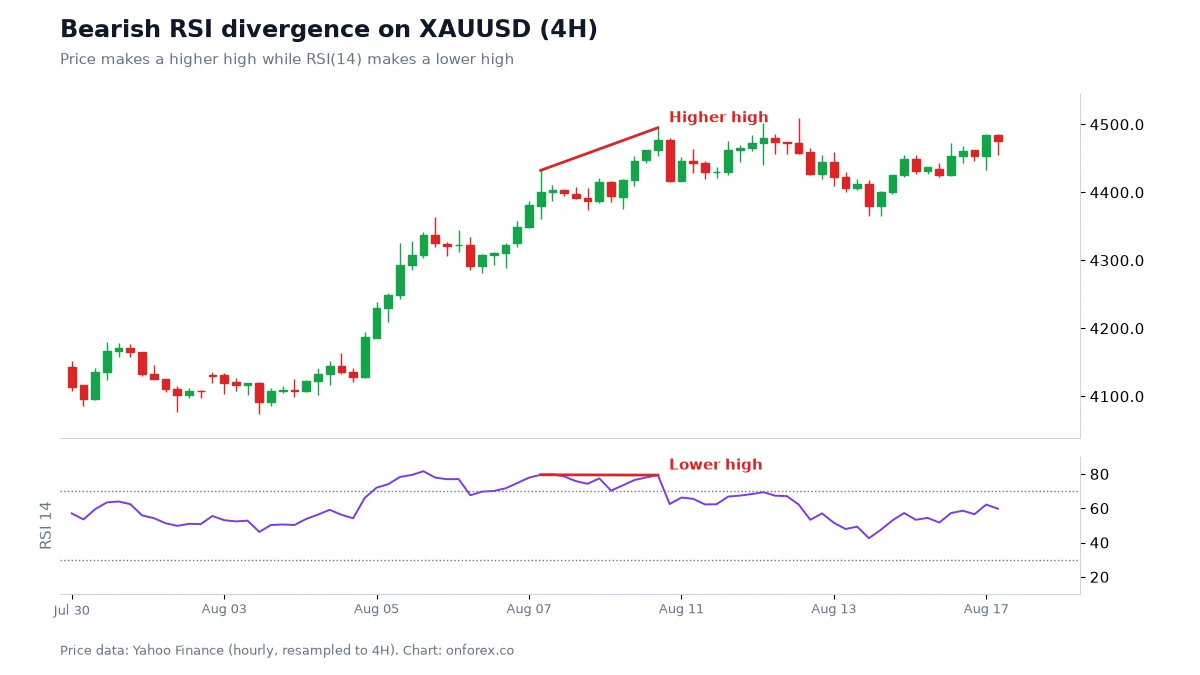
This example uses RSI, but the reading is identical with the stochastic. Be careful: in our RSI divergence test, price moved in the divergence direction 24 bars later only about half the time (for example 45.4% on EURUSD 1H and 56.6% on USDJPY 1H). See our divergence guide for the full numbers.
4. Stop and target still come first
Whatever the trigger, the stop goes where the idea fails, and the position size comes from that distance. See stop loss and position sizing.
Worked example
A trader marks a 4-hour uptrend on GBPUSD (price above a rising 50 EMA) and a support area near a prior swing low. On the 1-hour chart, price pulls back into that area and the stochastic falls below 20, then %K crosses above %D.
- The reason to trade is the trend and the level, not the cross.
- Entry on the close of the cross candle; stop below the swing low with a small buffer, say 15 pips.
- Risk 1% of a USD 1,000 account = USD 10. Pip value about USD 10 per standard lot, so size = 10 / (15 x 10) = 0.067, rounded down to 0.06 lots.
- Target the previous swing high, and check the reward is at least 1.5 to 2 times the risk (risk-reward ratio).
- If price closes below the swing low, the idea is wrong, whatever the stochastic says.
Avoid placing entries in the minutes around major news, when spreads widen and stops can fill with slippage. Our economic calendar guide shows which releases move the market.
Stochastic vs RSI
| Stochastic | RSI | |
|---|---|---|
| Measures | Close vs the recent high-low range | Average up moves vs average down moves |
| Common setting | 14, 3, 3 | 14 |
| Usual thresholds | 80 / 20 | 70 / 30 |
| Speed | Faster, reaches extremes more often | Smoother |
| Lines | Two (%K, %D), crosses watched | One |
Neither is better; they describe momentum in slightly different ways. Using both adds little, because they move together most of the time. See our RSI guide and MACD guide for the other common momentum tools.
Common mistakes
- Selling every reading above 80. In a trend, overbought can stay overbought for days, as the GBPUSD chart shows.
- Treating a cross as a signal on its own. In our 1-hour data, crosses did no better than the baseline.
- Optimising settings on past charts. The setting that fitted last year best is often just fitted to noise.
- Stacking oscillators. Stochastic, RSI and CCI showing the same thing is one piece of evidence, not three.
- Ignoring the higher timeframe and levels. The cross is a timing tool; the reason must come from somewhere else.
Related guides
For the wider picture, see price action, candlestick patterns, Bollinger Bands, multi-timeframe analysis and our list of forex strategies.
Practise on a demo account first
Mark structure, FVGs and stops on a free Exness demo account before you risk money. Forex and CFD trading carries a high risk of loss.
Continue to ExnessForex and CFD trading involves significant risk. You may lose your invested capital.
Risk warning: Forex and CFD trading carries a high risk of loss and is not suitable for everyone. Indicators describe past prices and do not predict future moves. Past test results do not guarantee future results. Never risk money you cannot afford to lose.
Related Articles
RSI Indicator: Settings, Strategies and What Our Data Shows
RSI indicator guide: Wilder's formula, the 14 setting, overbought and oversold levels and divergence, with tests on four markets of what RSI can do.
Parabolic SAR: Settings, Formula and Backtest Results
Parabolic SAR explained: the formula, 0.02 / 0.2 settings, how to read the dots, why it whipsaws, and what a flip-every-signal test showed on four markets.
ATR Indicator: Formula, Settings and ATR Stop-Loss in Forex
ATR explained: how Average True Range is calculated with a worked example, the 14-period setting, ATR stops, position sizing and our stop-hit data.
ADX Indicator: Settings, +DI/-DI and What Our Data Shows
ADX indicator guide: how ADX and +DI/-DI are calculated, what 20, 25 and 40 mean, how to use ADX to pick a method, and what our data shows on four markets.
Price Action Trading: How to Read Raw Charts Like a Pro
Learn price action trading from scratch in 2026. Master candlestick patterns, key support and resistance levels, and how to trade forex without lagging indicators.
Divergence in Forex: Regular and Hidden RSI/MACD Guide
Divergence explained: regular and hidden RSI and MACD divergence, how to spot it, why it fails, and what 965 cases in our own price data showed.