Parabolic SAR: Settings, Formula and Backtest Results
Parabolic SAR explained: the formula, 0.02 / 0.2 settings, how to read the dots, why it whipsaws, and what a flip-every-signal test showed on four markets.

This site contains affiliate links. We may earn a commission if you sign up through our links. How we research
Parabolic SAR (Stop and Reverse) is a trend indicator that plots a trail of dots below price in an uptrend and above price in a downtrend. When price touches a dot, the dots jump to the other side and the indicator signals a possible change of direction. J. Welles Wilder designed it in 1978 mainly as a trailing stop. In our tests it paid off only where markets trended for a long time and lost money in choppy ones.
Disclosure: OnForex may earn a referral commission from Exness links on this page. This is general education, not investment advice.
This guide explains the formula, the default 0.02 / 0.2 settings, how to read a flip, the main ways traders use it, and the results of a 4-hour test on EURUSD, GBPUSD, USDJPY and gold.
How Parabolic SAR works
The indicator follows the extreme point (EP): the highest high of the current uptrend, or the lowest low of the current downtrend. The dot for the next candle is:
SAR next = SAR now + AF x (EP - SAR now)
AF is the acceleration factor. It starts at 0.02 and rises by 0.02 every time price makes a new extreme point, up to a cap of 0.2. Early in a trend the dots stay far from price. As the trend extends, AF grows and the dots curve in closer, which gives the "parabolic" shape. When price trades through the dot, the trend is considered reversed: the SAR flips to the old extreme point, AF resets to 0.02, and the process restarts in the other direction.
| Parameter | Default | If you raise it | If you lower it |
|---|---|---|---|
| Step (starting AF and increment) | 0.02 | Dots chase price faster; more flips | Dots stay further away; fewer flips |
| Maximum AF | 0.2 | Tighter trailing stop late in a trend | Looser trailing stop |
Two things follow from the formula. First, the indicator always has a position: it is either long or short, never neutral. Second, its distance from price depends on time as well as price, so a sideways market eventually pulls the dots onto price and triggers a flip.
Reading the dots
- Dots below price: the indicator considers the trend up. Candles that stay above the dots keep that view.
- Dots above price: the indicator considers the trend down.
- A flip: price touches the dot, which then reappears on the opposite side. This is the reversal signal.
- Dot distance: a wide gap between price and dots means the move is young or stretched; a tiny gap means the trend is old and a flip is near.
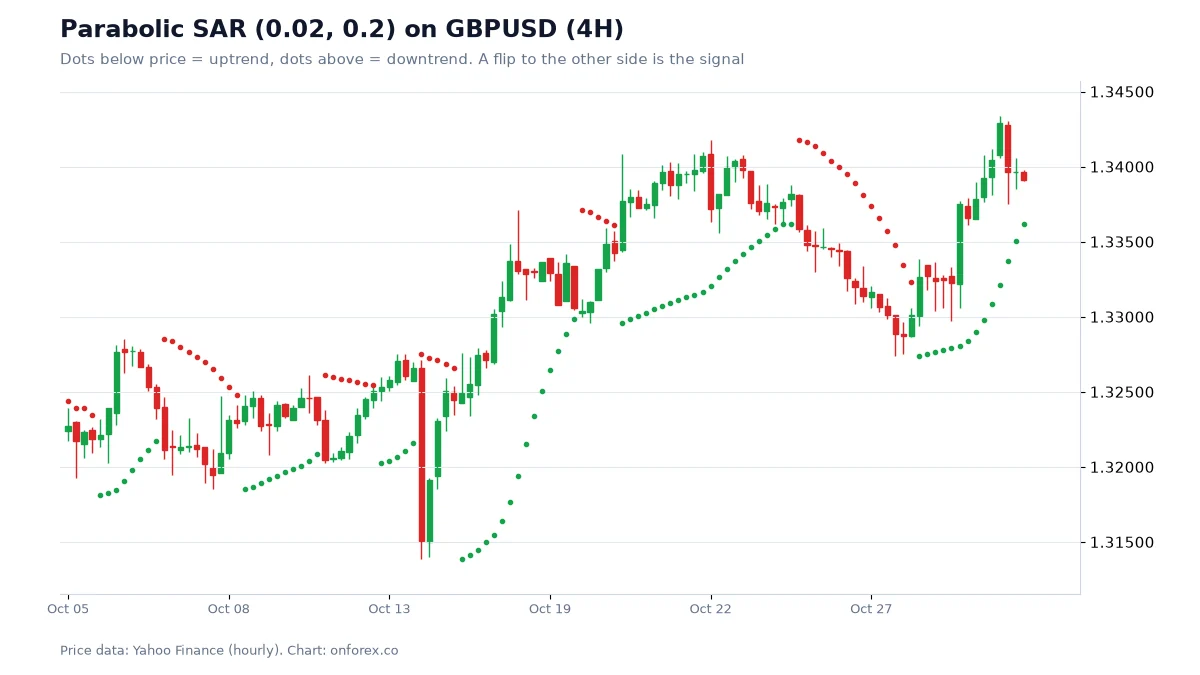
On the GBPUSD chart the pattern is easy to see. While price trends, the dots stay on one side and tighten gradually. Where price moves sideways, the dots catch up with price and flip repeatedly, and each flip would have meant a small loss for someone reversing at every signal. That whipsaw is the central weakness of the indicator, and it is the reason most experienced traders do not use it as a stand-alone entry.
Ways traders use Parabolic SAR
- Trailing stop. Hold a position opened for another reason (a structure break, a pullback entry) and move the stop to the latest dot. The stop never moves against you, and it tightens as the trend ages. See trailing stop.
- Trend-direction filter. Only take longs when the dots are below price and shorts when they are above, using another method for the entry itself.
- Stop and reverse system. Reverse at every flip. It is the most literal use of the indicator and the one we tested below.
- Combined with a strength filter. Use ADX or a moving average to decide whether the market is trending at all. If it is not, ignore SAR flips. See ADX and moving averages.
What our data shows
We ran the literal "always in the market" version on 4-hour candles: go long when the SAR flips below price, go short when it flips above, reverse at the close of the flip candle, and charge 1.2 pips per trade as an assumed cost. Settings 0.02 / 0.2. Source: OnForex analysis of hourly prices from Yahoo Finance, January 2024 - October 2026 (gold: June 2024 - October 2026, COMEX gold futures), resampled to 4-hour candles.
| 4-hour, flip every signal | EURUSD | GBPUSD | USDJPY | XAUUSD |
|---|---|---|---|---|
| Trades | 369 | 387 | 376 | 312 |
| Win rate | 38.5% | 36.4% | 38.3% | 44.2% |
| Net result | -519 pips | -1,824 pips | +697 pips | +USD 2,358 |
That is roughly 11 trades per month on each market. Three points stand out:
- The win rate was below 45% everywhere. This is the usual shape of trend following: many small losses and a few big wins. On EURUSD the average winner was +54.6 pips and the average loser -36.4 pips, so a 38.5% win rate was nearly enough to break even before costs, but not enough to cover them over this period.
- The result differed by market. Gold rose strongly through 2024-2026 and USDJPY trended for long stretches, which is a plausible reason the reversing system made money there; EURUSD and GBPUSD spent much of the period in ranges, where flips would be expected to lose. We did not test this explanation separately.
- One period, one set of settings. Results from 2.5 years on four markets do not show that SAR will work in the future. A different period or setting could change the sign of the result, and we did not test costs beyond the 1.2 pips or the effect of widened spreads and slippage.
The honest reading: a plain SAR reversal system is a bet that the market will trend. When it does, the system makes money, and when it does not, the system pays for every flip.
Worked example: a trailing stop from the dots
Assume you bought GBPUSD at 1.3300 on a structure break with an initial stop at 1.3250 (50 pips), risking 1% of a USD 1,000 account (USD 10). With a pip value of about USD 10 per standard lot, the size is 10 / (50 x 10) = 0.02 lots.
Price rises, and the SAR dot moves up to 1.3320. You move the stop there, so the trade can no longer lose money apart from slippage. Later the dot reaches 1.3380 and price pulls back to touch it; you are stopped out at about 1.3380, a gain of 80 pips (1.6R, where R is your initial risk). The dot never moves back, so you give up part of the trend in exchange for a rule that removes the guess about when to exit. Figures are illustrative. On fast moves or gaps the stop may be filled at a worse price (slippage), and spreads widen around news and market opens.
Choosing a time frame and settings
The same formula behaves very differently depending on the chart. On a 5-minute chart, spreads and noise dominate and the dots flip many times a day, so each flip costs a spread. On a daily chart a flip may arrive only a few times a year and by then a large part of the move is gone. The 4-hour chart we tested sits in the middle: about 11 flips a month per market, enough to react within days without paying costs every hour.
If you change the step, change it for a reason. A step of 0.01 gives the trend more room and suits a swing trader who accepts a deeper pullback before exiting. A step of 0.03 or higher tightens the stop quickly and suits someone who wants to lock in gains fast, at the price of more early exits. Before using any setting, check three things on your own chart: how many flips occurred in the last 100 candles, how far price typically travelled between flips, and what the loss per flip was after the spread. If the average move between flips is smaller than the spread plus a normal stop, the setting is not workable on that pair.
Common mistakes
- Using flips as entries in a range. Check whether the market is trending first; a flat ADX or a sideways moving average means expect whipsaws.
- Expecting a high win rate. Trend-following systems lose more often than they win. If you cannot handle long strings of small losses, SAR flips are not for you.
- Reversing without a risk rule. An always-in-the-market system has no stop apart from the flip, and a flip can be far from the entry in a fast market. Size positions so that the distance to the dot is a known percentage of the account.
- Optimising the step and maximum. Changing 0.02 / 0.2 until the past looks good creates an overfit rule. See backtesting.
- Ignoring the time frame. On 1-minute charts the dots flip constantly; on daily charts they flip rarely and lag. Pick the frame that matches your holding period.
- Treating a flip as a forecast. The dots describe what price already did. They are not a prediction.
Parabolic SAR compared with other tools
| Tool | Main job | Strength | Weakness |
|---|---|---|---|
| Parabolic SAR | Trailing stop and trend flip | Clear rule, always visible | Whipsaws in ranges |
| Moving average | Trend direction | Smooth, simple | Lags, slow exits |
| ATR trailing stop | Volatility-based stop | Adapts to volatility | Needs a multiplier choice |
| ADX | Trend strength | Tells trend from range | No direction by itself |
For a deeper look at stop placement, read stop-loss, and for the bigger picture see the technical analysis guide and trend trading.
Summary
Parabolic SAR is a simple, rule-based trailing stop that also flags a change of direction. Its dots follow price and tighten with time, which is useful for exits and for forcing discipline. As a reversal entry system it won on gold and USDJPY, lost on EURUSD and GBPUSD in our 4-hour test, and won only 36-44% of its trades. Use it as a trailing stop or beside a trend filter, keep position size tied to the stop distance, and test any change before risking money.
Practise on a demo account first
Follow SAR dots and trail a stop on a free Exness demo account before you risk money. Forex and CFD trading carries a high risk of loss.
Continue to ExnessForex and CFD trading involves significant risk. You may lose your invested capital.
Risk warning: Forex and CFD trading carries a high risk of loss and is not suitable for everyone. Past statistics do not predict future results, and nothing here is investment advice or a signal.
Related Articles
ADX Indicator: Settings, +DI/-DI and What Our Data Shows
ADX indicator guide: how ADX and +DI/-DI are calculated, what 20, 25 and 40 mean, how to use ADX to pick a method, and what our data shows on four markets.
ATR Indicator: Formula, Settings and ATR Stop-Loss in Forex
ATR explained: how Average True Range is calculated with a worked example, the 14-period setting, ATR stops, position sizing and our stop-hit data.
RSI Indicator: Settings, Strategies and What Our Data Shows
RSI indicator guide: Wilder's formula, the 14 setting, overbought and oversold levels and divergence, with tests on four markets of what RSI can do.

Stochastic Oscillator: Settings, Formula and What Our Data Shows
How the stochastic oscillator works: the %K and %D formula, 14,3,3 settings, fast vs slow vs full, overbought and oversold crosses tested on four markets.

Trailing Stop Loss in Forex: Trailing, Break Even and Partial TP
How a trailing stop loss works in forex, plus break even stops and partial take profit, compared on the same EURUSD entries with our own test data.

Moving Averages in Forex: SMA, EMA, 200-Day Data
Moving averages in forex: SMA vs EMA formulas, 50/200 golden and death crosses, common periods, and what 9 years of daily data show about the 200-day line.