Technical Analysis in Forex: A Practical Guide With Data
Technical analysis in forex explained: trends, support and resistance, indicators, candlesticks and SMC, plus our own test of whether the signals beat chance.
This site contains affiliate links. We may earn a commission if you sign up through our links. How we research
Technical analysis is the study of price charts, and of indicators calculated from price and time, to describe what a market is doing and to plan trades. It ignores the economic reasons behind a move and reads the one thing every participant leaves behind: the price record. In forex it is used to judge direction, choose entry and exit areas, and place stops at a measured distance.
This guide is a map of the whole subject. It explains each family of tools, links to a full page on each, and then asks the question most guides skip: does any of it beat chance? We tested it on our own data, and the answer shapes how you should use everything below.
Disclosure: OnForex may earn a referral commission from Exness links on this page. This is general education, not investment advice.
What technical analysis assumes
Classical technical analysis rests on three ideas from Dow theory:
- Price reflects available information. News, rates and positioning are already in the chart, so the chart is a summary.
- Price moves in trends. A trend is more likely to continue than to reverse, until the evidence says otherwise.
- Behaviour repeats. Fear, greed and herding produce similar shapes in different decades and markets.
These are assumptions, not laws. The second one is the most useful and the most abused. Markets spend long stretches in ranges, and a method that assumes a trend will lose money there. The skill is not in having a tool; it is in knowing which condition you are in. That is also why the rest of this page keeps coming back to risk: being wrong is normal, so the size of the loss must be planned before the trade.
Chart types and time frames
Three chart types cover almost all use:
| Chart | What it shows | Best for |
|---|---|---|
| Candlestick | Open, high, low and close of each period | Reading momentum and rejection; the standard |
| Bar (OHLC) | The same four prices as ticks on a stem | Cleaner look with many bars |
| Line (close) | Only closing prices joined | Seeing the big picture, drawing trend lines |
Time frame is the length of one candle. Daily and 4-hour charts show the main swings. 1-hour and 15-minute charts show the detail. A 10-pip stop is a big part of a 5-minute candle but barely visible on a daily one, and the spread (the difference between the buy and sell price) takes a much larger share of a short-term target. The spread also widens around news and the market open, so a plan that works on paper at 08:30 New York time can fill worse.
A practical habit is multi-timeframe analysis: decide the direction on a higher chart, then look for the entry on a lower one. It avoids the common error of buying a small bounce inside a large decline.
Trend and market structure
The first thing to read on any chart is the sequence of swings. A swing high is a peak with lower prices on both sides; a swing low is a trough. Higher highs (HH) and higher lows (HL) describe an uptrend, lower highs (LH) and lower lows (LL) a downtrend, and a mixture is a range.
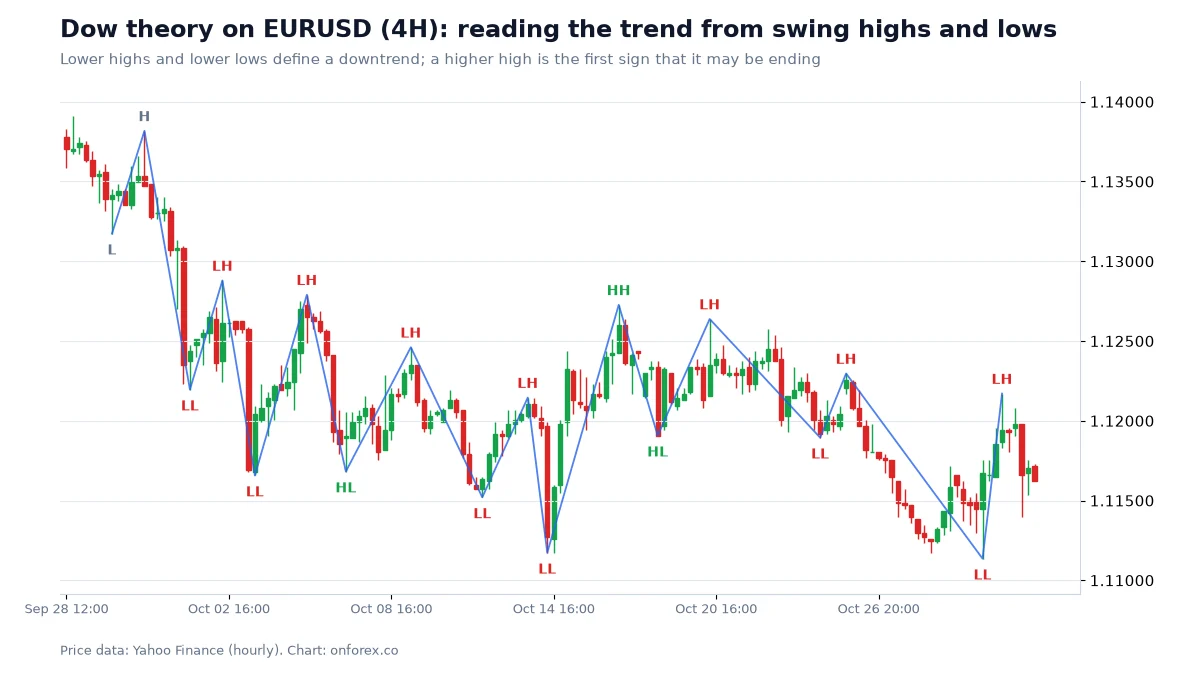
The chart shows a downtrend with one attempt to turn. The attempt printed a higher low but never a higher high, so the downtrend was not broken. Reading that difference is most of trend analysis. The modern version, with names such as BOS (Break of Structure) and MSS (Market Structure Shift), is covered in market structure and Smart Money Concepts.
In our test of structure breaks over January 2024 to October 2026, a break of structure was followed by a further 1 ATR of movement before price closed back through the level in about 61 to 68 percent of cases across EURUSD, GBPUSD, USDJPY and gold. That is better than a coin flip, and it is what makes trend following possible, but it also means roughly one break in three failed quickly.
Support, resistance and price action
Support is an area where falling price has paused or reversed before; resistance is the same for rising price. They are best drawn as zones, not exact lines. Prior highs and lows, round numbers and pivot points are the usual candidates. The full method is in support and resistance, and the way traders read the reaction at those areas is price action.
We checked whether obvious levels behave differently from arbitrary ones. On EURUSD and GBPUSD, price reversed 20 pips from a round number before moving 20 pips through it in about 44 percent of first touches, slightly less often than at control levels placed between the round numbers (about 51 percent and 50 percent). In other words, a level that everybody sees is not a guaranteed wall. Orders cluster beyond obvious levels, which is why liquidity sweeps happen. Use levels to decide where you are wrong, not as a reason to expect a bounce.
Indicators by family
An indicator is a formula applied to price (and sometimes volume). Almost all of them are built from the same inputs, so they overlap heavily. It helps to group them by what they measure.
Trend indicators
They smooth price to show direction. The moving average is the base tool; the ADX measures how strong a trend is without giving its direction; the Parabolic SAR trails price with dots and is mostly used for exits; and Ichimoku combines several lines into one view.
Momentum indicators
They compare current price with recent price to show speed. The RSI is bounded between 0 and 100, the MACD measures the gap between two moving averages, and the stochastic oscillator shows where the close sits in the recent range. Their disagreement with price is called divergence.
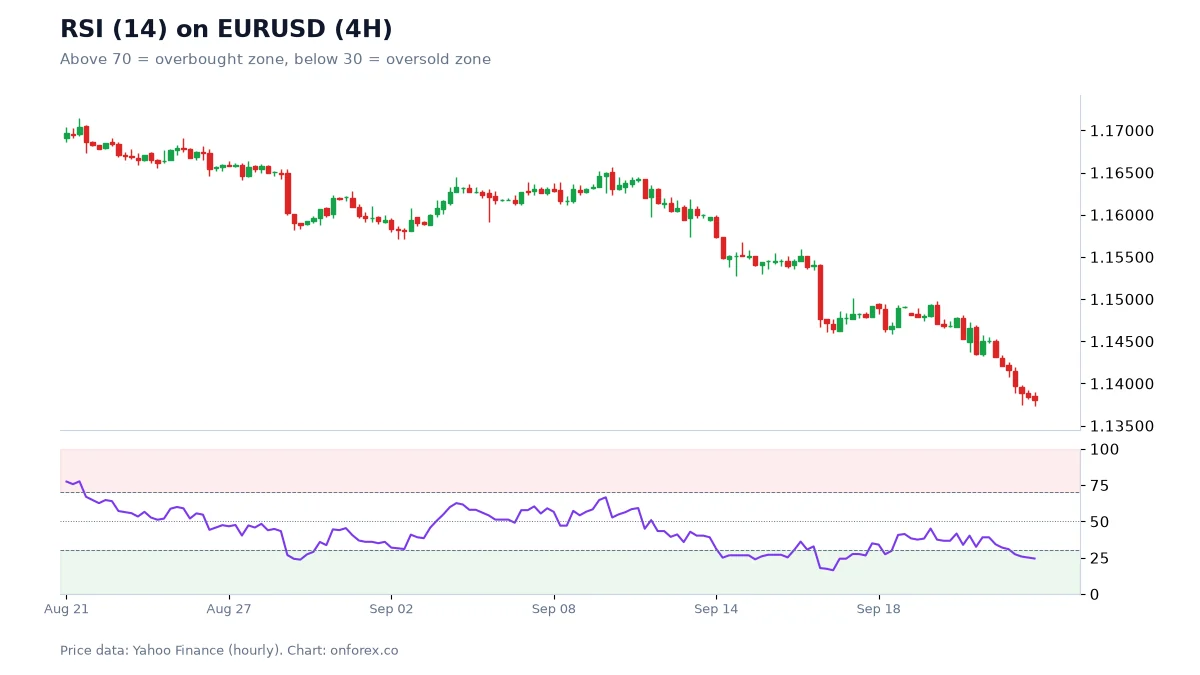
The RSI panel makes the central problem of momentum tools clear. A reading below 30 means the recent decline was fast, not that the decline is over. In a strong move an indicator can stay at an extreme for days.
Volatility indicators
They measure how large the moves are. ATR (Average True Range) is the plain average of recent candle ranges and is the most practical tool for sizing a stop loss. Bollinger Bands place a band two standard deviations around a 20-period average.
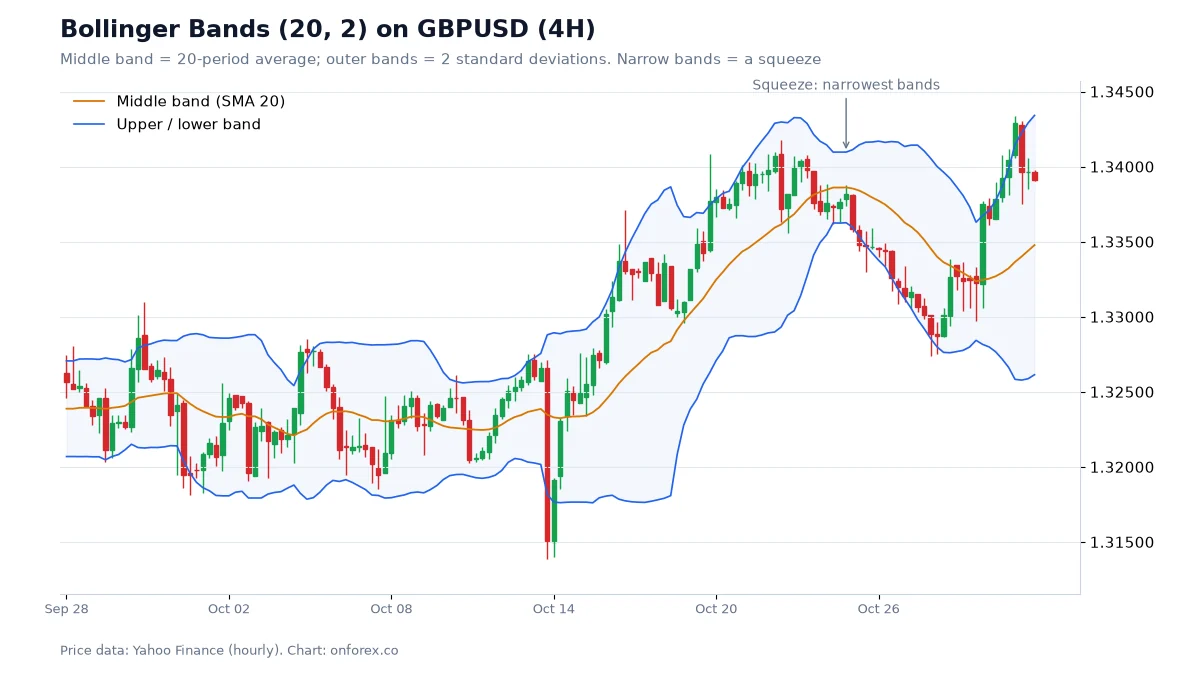
This is the one volatility result that held up in our data. After a squeeze (band width in the lowest 10 percent of the last 120 bars), the median range over the next 24 hourly bars was about 15 to 25 percent larger than normal. The first close outside the bands then continued in the same direction only about half the time (48.7 to 54.3 percent). A squeeze says to expect a bigger move; it does not say which way.
Candlesticks and chart patterns
A candlestick packs four prices into one shape, and some shapes have names: the engulfing pattern, the pin bar and the inside bar are the most used. Larger formations such as the head and shoulders and the double top are built from swings rather than single candles.
On 4-hour charts, a bullish engulfing candle was followed by a higher price 24 hours later in 48 to 63 percent of cases, against a baseline of 48 to 56 percent for the same markets. The strongest-looking figures came from samples of 22 to 51 cases, which is too few to trust. Inside-bar breaks went upward about half the time. Candlestick patterns are better as a way to see rejection at a level you chose beforehand than as a stand-alone signal.
Smart Money Concepts as a modern school
SMC and ICT are a newer vocabulary for the same chart-reading job: structure, liquidity (areas where many stop orders sit), order blocks, fair value gaps, premium and discount and session timing such as kill zones. The language is more detailed and the claim about who moves the market is not provable, but the descriptions of price can be measured.
Our measurements say two things. Fair value gaps were revisited to their midpoint within 24 hours in about 73 to 76 percent of cases, which is common but largely normal mean reversion after fast candles. Order blocks held about half the time (47.7 to 53.1 percent). Treat them as places to watch.
Multi-timeframe analysis in practice
A workable routine uses three charts. On the daily, mark the direction and the large levels. On the 4-hour, mark the swings and the area you want to trade from. On the 1-hour, wait for price to react there and place the stop beyond the swing with a buffer measured in ATR. If the three disagree, the honest answer is to skip the trade. See multi-timeframe analysis for the steps.
Does technical analysis work? What our data shows
This is the question that matters. We compared single signals with a baseline: the share of all bars where price was higher the same number of bars later. A signal only adds something if it clearly beats its baseline.
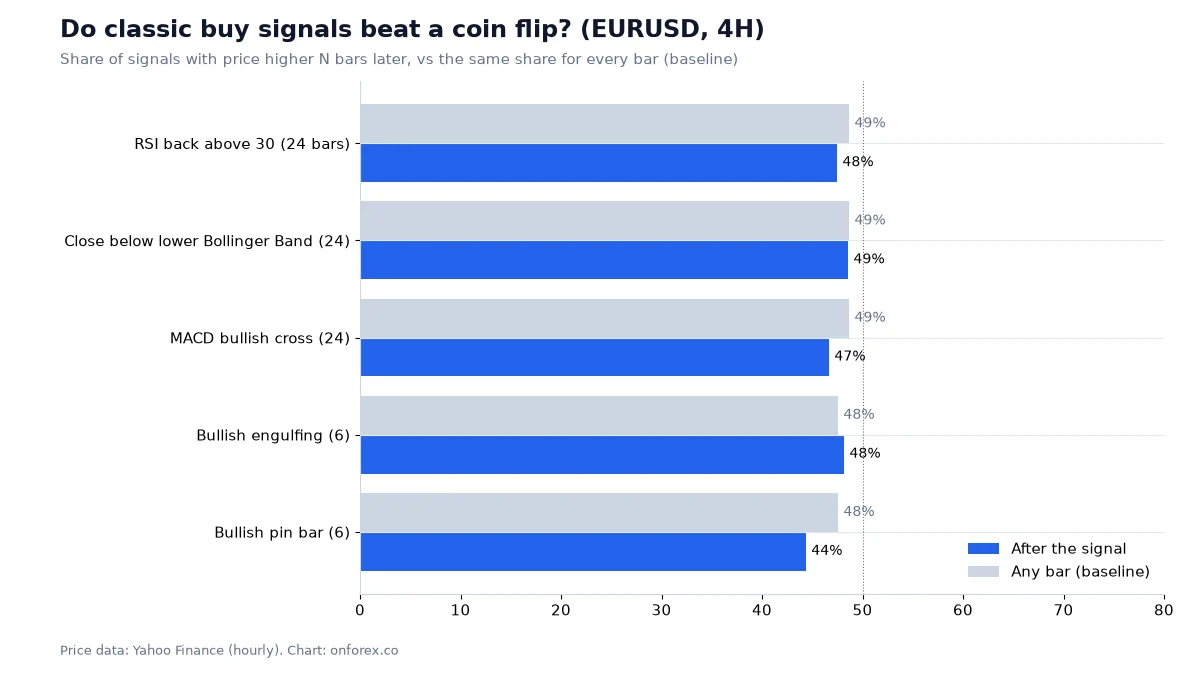
The figures come from OnForex analysis of hourly prices from Yahoo Finance, January 2024 to October 2026 (gold: June 2024 to October 2026, COMEX gold futures), with 4-hour bars built from the hourly data. Daily moving-average figures use daily prices from August 2017 to October 2026.
| Test | Result | Baseline or comparison |
|---|---|---|
| RSI back above 30, price higher 24 bars later (1H, EURUSD) | 56.0% (248 cases) | 47.7% |
| RSI back above 30 (4H, EURUSD) | 47.5% (81 cases) | 48.7% |
| Close below lower Bollinger Band, price higher 24 bars later (1H, EURUSD) | 51.6% | 47.7% |
| Bullish MACD signal cross (1H, EURUSD) | 45.7% | 47.7% |
| Above the 200-day average, higher 20 days later (EURUSD) | 48.5% | 46.8% |
| Fibonacci levels 38.2, 50, 61.8 (pullbacks ending within 3 points) | 18.5% | 16.7% for shifted control levels |
| ADX above 25, next 20-bar move same sign as the last (EURUSD 4H) | 49.1% | about 50% |
The pattern is consistent. Most signals landed within a few points of the baseline. With 50 to 250 cases, a gap of a few points is noise, so the single better cell (RSI on EURUSD 1H, 8 points above baseline) should not be read as an edge on its own. The Parabolic SAR, run as an always-in-the-market system on 4H, lost 519 pips on EURUSD and 1,824 pips on GBPUSD over the period, and made money only where a market trended strongly for a long time (gold and USDJPY).
Two things in our data do hold up, and both are about description, not prediction:
- Volatility clusters. Quiet periods precede larger ranges, and the busiest hours are predictable: the average EURUSD hourly range is about 15 pips in the London open and 17 to 19 pips in the New York session, against 7 to 8 pips overnight.
- Stops are hit often when they are tight. For random entries on these four markets, a stop of 1 ATR was hit within 24 hours about 73 to 78 percent of the time, and a stop of 2 ATR about 51 to 56 percent. Where your stop sits matters at least as much as the signal.
So technical analysis, used to forecast, is roughly a coin flip with extra steps. Used to measure, to find where you are wrong and to size the position, it is useful.
How to build a simple technical routine
- Choose a market and one time frame for direction. Mark swing highs and lows and decide: uptrend, downtrend or range.
- Mark two or three levels. Prior highs and lows, a round number, an area where price turned more than once.
- Add at most two indicators. One for trend or volatility (a moving average or ATR) and one for momentum if you want it. Write down what each one adds.
- Define the setup in a sentence. For example: "Pullback to the 20-period average in an uptrend, entry on a close back above the last small high."
- Place the stop first. Beyond the invalidation point plus an ATR buffer, then size the position from it using position sizing.
- Check reward to risk. Look at the risk-reward ratio before entry, not after.
- Test before you trade it. Backtest on data you did not use to design the rule, then run it on a demo account.
- Record each trade. The journal tells you what actually works for you.
Common mistakes
- Stacking indicators. RSI, stochastic and MACD are three views of the same momentum. Five indicators do not give five confirmations.
- Treating overbought as a sell signal. In a strong trend, an indicator stays at an extreme. Gold was above RSI 70 on about 12 percent of 4-hour bars in our sample because it trended up.
- Choosing swings after the fact. Levels and Fibonacci legs drawn on a finished move always look perfect. Draw them in real time.
- Ignoring costs. Spread, slippage and swap are paid on every trade, and they matter more the shorter the target is.
- Over-fitting. Tuning a setting until it fits history is how backtests look good and live trading does not.
- Skipping risk management. A method with a small edge is wiped out by oversized positions. In our simulation of 200 trades at a 45 percent win rate and 1.5R reward, the median maximum drawdown was about 12 percent at 1 percent risk per trade and 49 percent at 5 percent risk. Read risk management before you read another indicator guide.
Related reading
- Price action trading and read forex charts
- Trading strategies overview and trend trading
- Money management and trading psychology
Practise before you risk money
Practise on a demo account first
Mark structure, FVGs and stops on a free Exness demo account before you risk money. Forex and CFD trading carries a high risk of loss.
Continue to ExnessForex and CFD trading involves significant risk. You may lose your invested capital.
Risk warning: Forex and CFD trading carries a high risk of loss and is not suitable for everyone. Past results, including the statistics on this page, do not predict future results. Spreads widen around news and market opens, and stop orders can fill at worse prices than set. This page is general education, not investment advice.
Related Articles
How to Read Forex Charts: Complete Beginner's Guide 2026
Learn how to read forex charts step by step. Understand candlesticks, trend lines, support and resistance, and key chart patterns with practical examples.
Forex Candlestick Patterns: 16 Key Patterns and How to Use Them
Forex candlestick patterns in one table: what 16 key patterns show, the confirmation to wait for, entry and stop rules and why patterns alone are weak.
MACD Indicator: How to Use MACD in Forex (Formula + Example)
MACD indicator in forex explained: the 12/26/9 formula, signal line and histogram, a worked numeric example, divergence, structure filters and limits.
What Is Exness? How It Works, Makes Money and Where It Operates
What is Exness? A plain-English guide to the broker: who runs it, how it makes money, what you can trade, which entities and regulators it uses, and where it is located.
Smart Money Concepts (SMC) Explained: ICT Basics and Our Data
Smart money concepts (SMC) explained: what ICT terms like BOS, order block and FVG mean, how a top-down read works, and what our own price data shows.

Swing Trading Forex: Strategy, Holding Time and Our Data
Swing trading forex explained: how long swings last, how big they are in pips, a step-by-step swing trading strategy, swap and weekend risk, and sizing.