Pivot Points in Forex: Formula, Levels and Touch Rates
Pivot points explained: the floor formula with a worked example, Camarilla and Fibonacci pivots, how traders use them, and how often price touched them.

This site contains affiliate links. We may earn a commission if you sign up through our links. How we research
Pivot points are horizontal levels calculated from the previous period's high, low and close. The central level, the pivot (P), is the average of those three prices, and the support (S1, S2) and resistance (R1, R2) levels are placed above and below it using fixed formulas. Because they are known before the session starts, every trader using the same method sees the same lines.
Disclosure: OnForex may earn a referral commission from Exness links on this page. This is general education, not investment advice.
This page gives the classic (floor) formula with a worked example, explains the Camarilla and Fibonacci variants, shows how traders actually use the levels, and reports how often price touched them in our own data. The short version: price reaches pivots often, but it does not reliably reverse from them. They work best as reference points for planning stops and targets. For other level-based tools see support and resistance and Fibonacci.
Classic (floor) pivot point formula
The classic version was used by floor traders in futures pits, hence "floor pivots". Take the previous day's high (H), low (L) and close (C):
| Level | Formula |
|---|---|
| P (pivot) | (H + L + C) / 3 |
| R1 | 2 x P - L |
| S1 | 2 x P - H |
| R2 | P + (H - L) |
| S2 | P - (H - L) |
| R3 | H + 2 x (P - L) |
| S3 | L - 2 x (H - P) |
Most chart platforms draw these automatically, and the popular platforms use this formula by default. The calculation is worth knowing once so that you understand what the lines are: P is simply a weighted midpoint of yesterday, R1 and S1 mirror P around yesterday's low and high, and R2 and S2 are yesterday's full range added to or subtracted from P.
Worked example
Take a made-up EURUSD day with a high of 1.11620, a low of 1.10980 and a close of 1.11310. The range is 64 pips.
- P = (1.11620 + 1.10980 + 1.11310) / 3 = 1.11303
- R1 = 2 x 1.11303 - 1.10980 = 1.11627
- S1 = 2 x 1.11303 - 1.11620 = 1.10987
- R2 = 1.11303 + 0.00640 = 1.11943
- S2 = 1.11303 - 0.00640 = 1.10663
These numbers are an illustration, not a real day. On a live chart you do not calculate by hand; you check that the platform is using the right daily close for your broker (see the note on time zones below). Notice that R1 lands almost exactly on yesterday's high and S1 almost exactly on yesterday's low, because the close was near the middle of the range. If the close had been near the high, P would shift up and the whole set of levels would move up with it.
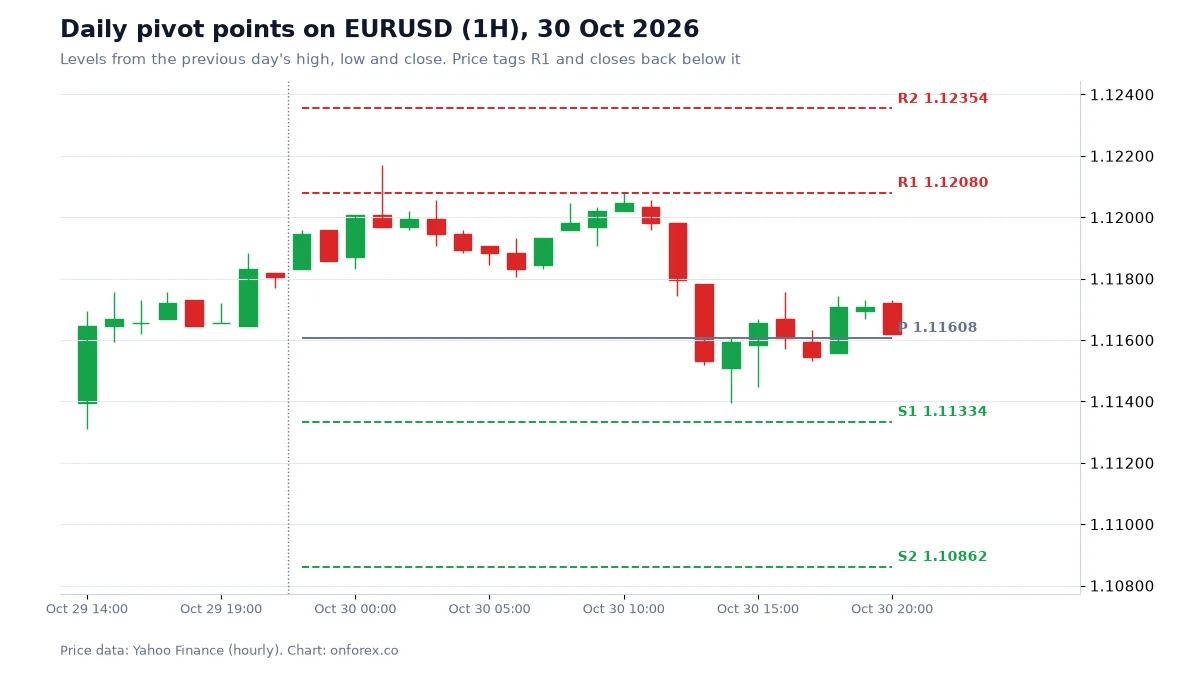
On the chart, the levels are horizontal lines drawn at the start of the day. Price tags R1 and closes back below it, which is the textbook reaction. One example proves nothing, which is why we measured it across many days below.
Camarilla and Fibonacci pivots
The formulas differ only in how far the outer levels sit from the pivot.
- Fibonacci pivots keep the same P but place S and R at fixed fractions of the previous range: R1 = P + 0.382 x (H - L), R2 = P + 0.618 x (H - L), R3 = P + 1.000 x (H - L), with S levels mirrored below. They are useful if you already think in Fibonacci ratios.
- Camarilla pivots cluster the levels around the previous close with ratios based on 1.1: R3 = C + 1.1 x (H - L) / 4 and R4 = C + 1.1 x (H - L) / 2, with S3 and S4 mirrored. The usual convention is that R3/S3 are fade areas in a range and R4/S4 are break areas, but that is a convention, not a finding.
If you have no strong reason to choose another set, the classic version is the one other traders watch most often, which is the only real advantage of any pivot method: shared attention.
How traders use pivot points
There are three common uses, and none claims that price must react.
- Reference levels for a plan. Mark P, R1/R2 and S1/S2 before the session. Use them as places where you will look more closely, like a map.
- Bias. Price above P at the open is often read as mildly bullish for the day, below P as mildly bearish. This is a loose rule of thumb that we did not test.
- Targets and stops. If you are long from near P, R1 is a visible first target; a stop sits beyond the level that would show the idea was wrong. You can check the distance against ATR to see whether it is realistic for that market on that day.
Pivots do not replace structure. Many traders combine them with market structure or price action: the pivot says where, the candles say whether anything is happening there.
What our data shows
We calculated classic floor pivots from the previous trading day (day = 22:00 to 22:00 UTC) and counted the share of days on which price touched each level, plus what happened on days that touched R1 or S1.
| Share of days the level was touched | EURUSD | GBPUSD | USDJPY | XAUUSD |
|---|---|---|---|---|
| P | 76.8% | 76.0% | 76.0% | 74.3% |
| R1 / S1 | 42.1% / 42.4% | 43.5% / 41.8% | 44.4% / 38.4% | 44.0% / 39.1% |
| R2 / S2 | 18.4% / 18.1% | 17.1% / 17.6% | 18.5% / 18.1% | 18.9% / 15.6% |
| Day that touched R1 closed back below R1 | 50.2% | 50.0% | 48.8% | 41.1% |
| Day that touched S1 closed back above S1 | 46.8% | 49.7% | 51.6% | 51.0% |
Source: OnForex analysis of hourly prices from Yahoo Finance, January 2024 - October 2026 (gold: June 2024 - October 2026, COMEX gold futures). "Touched" means the day's high or low reached the level.
Three things stand out.
- P is touched about three days in four, and R1/S1 on roughly four days in ten. R2/S2 are reached on about one day in five. The levels are not far away.
- A touch of R1 or S1 is followed by a close back on the original side about half the time (around 50% on EURUSD and GBPUSD). That is a coin flip, so the level did not hold more often than it failed.
- Gold was different on the upside: days that touched R1 closed back below it only 41.1% of the time, so more often than not the day closed above R1. A reversal trade from R1 on gold would have been fighting the sample.
The honest conclusion is that pivots are places where price often goes, not places where price usually turns. That makes them better for planning than for firing off entries. Remember too that a daily range is mostly decided during the active sessions; our hourly range data shows the most movement in the London and New York hours (below), so touches probably happen mostly then (we did not measure when touches occur).
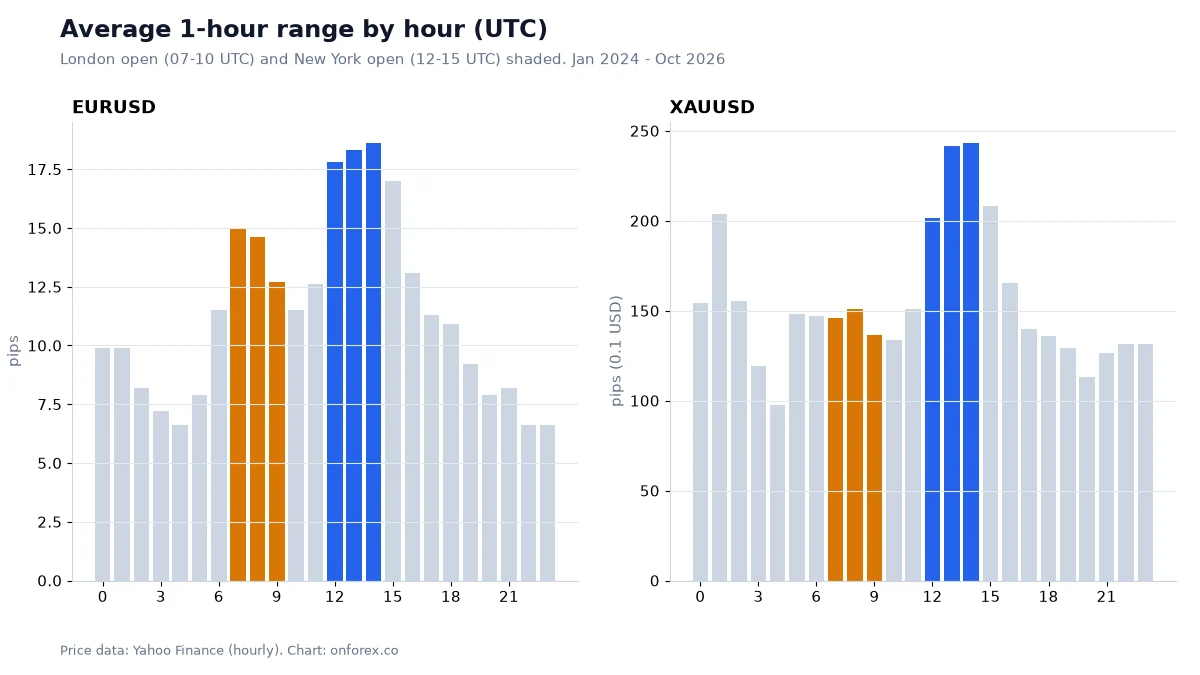
Because a pivot touch can arrive when ranges are largest, spreads and slippage matter. Spreads widen around the session opens and news, so a limit order or stop at a pivot can fill at a worse price than the line suggests. Our trading hours and ICT kill zones pages show which hours these are.
Time zones and the daily close
The classic calculation depends on what counts as "the previous day". Most forex platforms use a daily close in New York time at 17:00 (22:00 UTC in northern-hemisphere winter, 21:00 UTC in summer), but some use the broker server's own time, and a different day boundary changes the high, low and close and therefore every level. If your platform's pivots do not match another source, a different day boundary is the first thing to check. Weekends and market holidays also shift the previous day. Our study uses 22:00-22:00 UTC as the day, so it may differ slightly from your platform.
Putting a pivot into a trade plan
Suppose price pulls back to S1 in a rising market and you want to test a long idea with a pivot as the reference. A stop sits beyond S1 and beyond the recent low with a buffer for noise, and the first target is P or R1.
If the stop is 20 pips from entry and the account is USD 1,000 with 1% risk (USD 10), the position size is 10 / (20 x 10) = 0.05 lots on EURUSD at about USD 10 per pip per standard lot. If R1 is 40 pips away, the reward is 2R before costs. The calculation is the same one as in lot size and position sizing, and the reward comparison is in risk-reward ratio.
How tight should the stop be? On our hourly data a random entry with a stop 1 ATR away was hit within 24 hours in about three cases out of four; at 3 ATR it was about one in three.
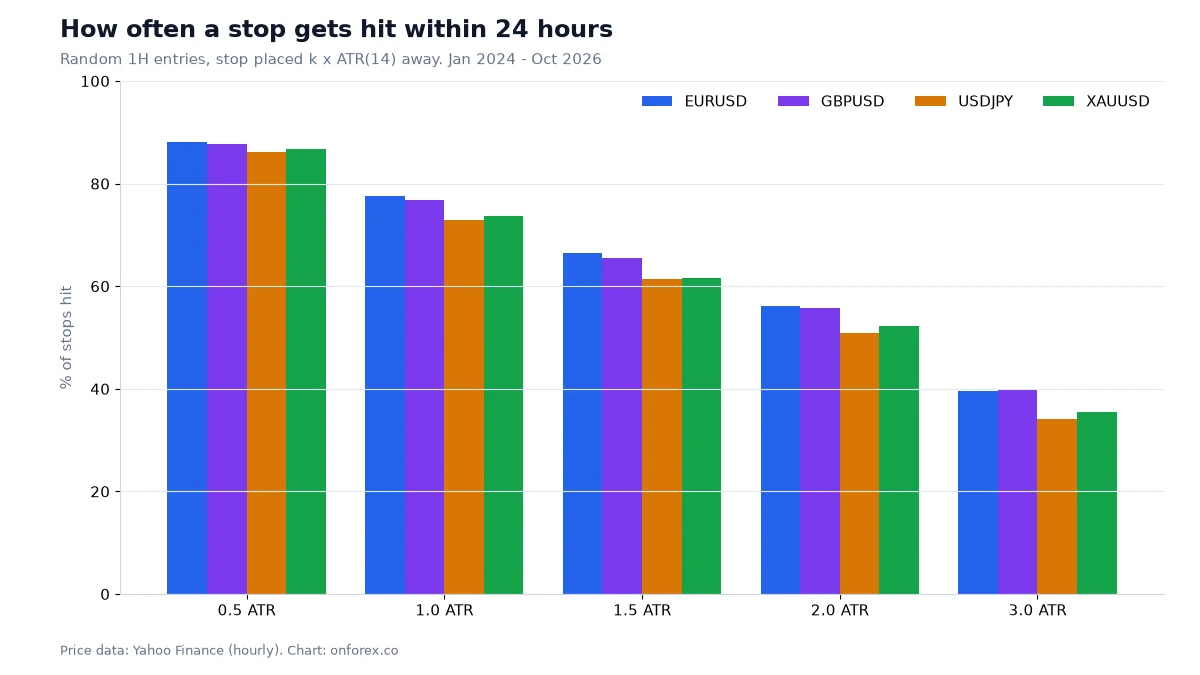
A 20-pip stop is therefore only sensible if it is wide enough relative to the day's normal movement; check ATR first rather than assuming the pivot gap is the right stop distance. See stop loss.
Common mistakes
- Treating a pivot as a wall. About half of R1/S1 touches in our data did not hold.
- Mixing day boundaries. If your pivot differs from a friend's, check the daily close time.
- Entering at the line with a stop just beyond it. Stops cluster there and noise often reaches them.
- Ignoring the session. A touch during the quiet Asian hours means less than one in London or New York, and spreads differ.
- Using pivots alone. Add structure, candles and a written stop and size.
- Forgetting the time period. Daily pivots suit intraday trades. For multi-day trades, weekly pivots give wider levels.
Where to go next
If you want other level tools, see support and resistance, Fibonacci and the moving averages guide. For intraday planning read day trading and scalping, and for how pivots fit into trend entries see breakout strategy. A background on the idea is on Wikipedia.
Practise on a demo account first
Add pivot points to a chart on a free Exness demo account and practise planning stops and targets before you risk money. Forex and CFD trading carries a high risk of loss.
Continue to ExnessForex and CFD trading involves significant risk. You may lose your invested capital.
Risk warning: Forex and CFD trading carries a high risk of loss, and many retail accounts lose money. Statistics here describe past data under our definitions and do not predict future results. Nothing on this page is investment advice.
Related Articles

Premium and Discount in ICT: Dealing Range and OTE
Premium and discount explained: how to mark a dealing range, find equilibrium at 50%, and use the OTE zone (62%, 70.5%, 79%) with a worked example.
RSI Indicator: Settings, Strategies and What Our Data Shows
RSI indicator guide: Wilder's formula, the 14 setting, overbought and oversold levels and divergence, with tests on four markets of what RSI can do.

Risk Reward Ratio in Forex: R Multiples, Win Rate and Expectancy
Risk reward ratio explained with R multiples, the break-even win rate table, an expectancy formula with worked examples, and why a higher ratio is not always better.

Fibonacci Retracement in Forex: Levels, Drawing, Data
Fibonacci retracement for forex: how to draw it, what 38.2%, 50% and 61.8% mean, and what 1,135 pullbacks show about whether price really respects the levels.

Pin Bar: How to Spot, Trade and Test a Pin Bar Candle
Pin bar explained: bullish and bearish pin bar rules, where they matter, a worked trade with stop and sizing, plus how pin bars performed in our 4-market data.

Online Forex Trading: How It Works, Costs and Getting Started
Online forex trading explained: platforms, order types, spread, commission and swap, with a worked trade showing cost, profit and loss.