Compounding in Forex: Formula, Calculator Table and Reality
How compounding works in forex: the formula, monthly compounding tables, the rule of 72, volatility drag, and our simulation of compounding vs fixed size.
This site contains affiliate links. We may earn a commission if you sign up through our links. How we research
Compounding in forex means calculating each new position from your current balance, so gains increase the size of later trades and losses reduce it. The formula is final balance = start x (1 + r)^n, but trading returns are not a fixed interest rate: in our 200-trade simulation at 1% risk, compounding finished with a median of 1.264x the starting balance against 1.250x for a fixed size. Compounding scales whatever results your method produces; it does not create an edge.
Disclosure: OnForex may earn a referral commission from Exness links on this page. This is general education, not investment advice.
This page shows the arithmetic with exact tables, explains why the famous "1% a day" charts mislead, and reports our own simulation of compounding against fixed position sizing. Nothing here is a plan to grow an account by a given amount; it is about understanding what the numbers do.
The compounding formula
For a steady return per period:
Final balance = Starting balance x (1 + r)^n
- r = return per period as a decimal (3% = 0.03)
- n = number of periods (months, weeks or trades)
Example: 1,000 USD at 3% a month for 12 months = 1,000 x 1.03^12 = 1,425.76 USD. Without compounding (taking the profit out each month so you always trade 1,000 USD), the same 3% a month gives 1,000 + 12 x 30 = 1,360 USD. The 65.76 USD difference is the "interest on interest".
To find the return per period that turns A into B over n periods, reverse the formula: r = (B / A)^(1/n) - 1.
Compounding table: monthly returns
The table shows what 1,000 USD becomes if a fixed monthly return is achieved every single month, compared with the same return without compounding. Values are calculated exactly and rounded to the cent.
| Monthly return | 12 months | 24 months | 36 months | 36 months without compounding |
|---|---|---|---|---|
| 1% | 1,126.83 (1.13x) | 1,269.73 (1.27x) | 1,430.77 (1.43x) | 1,360 (1.36x) |
| 3% | 1,425.76 (1.43x) | 2,032.79 (2.03x) | 2,898.28 (2.90x) | 2,080 (2.08x) |
| 5% | 1,795.86 (1.80x) | 3,225.10 (3.23x) | 5,791.82 (5.79x) | 2,800 (2.80x) |
| 10% | 3,138.43 (3.14x) | 9,849.73 (9.85x) | 30,912.68 (30.91x) | 4,600 (4.60x) |
Two things stand out. Compounding barely matters at low returns over short periods (1% a month: 1,431 vs 1,360 after three years). And the dramatic numbers in the bottom row depend on a return that never has a losing month. A table cannot tell you whether any of these returns is achievable; it only shows what the formula does if they were.
The "1% a day" problem
Popular compounding charts often show 1% a day. The arithmetic is correct: 1.01^365 = 37.8x in a year, or 12.0x over 250 trading days. The assumption is not. It requires every day to be a winning day of the same size. Real trading has losing trades, and a method with an edge still has strings of them: in our Monte Carlo test of a profitable method (45% win rate, 1.5R reward), the median longest losing streak in 200 trades was 8, and the 90th percentile was 11. Daily targets also push traders to force trades or increase size after a loss, which is the start of martingale thinking.
Rule of 72
A quick way to estimate doubling time: 72 / return per period = periods to double.
| Return per period | Rule of 72 estimate | Exact doubling time |
|---|---|---|
| 1% | 72 | 69.7 |
| 3% | 24 | 23.4 |
| 5% | 14.4 | 14.2 |
| 10% | 7.2 | 7.3 |
It works for steady returns. For trading results that swing up and down, the real doubling time depends on the path, which is the next section.
Why trading returns do not compound like interest
Volatility drag
Gains and losses of the same percentage do not cancel:
| Sequence | Result |
|---|---|
| +10% then -10% | 1.10 x 0.90 = 0.99, a 1% loss |
| +20% then -20% | 1.20 x 0.80 = 0.96, a 4% loss |
| +50% then -50% | 1.50 x 0.50 = 0.75, a 25% loss |
The bigger the swings, the more the average return overstates the compound return. This is why large risk per trade can shrink an account even when the average trade is positive.
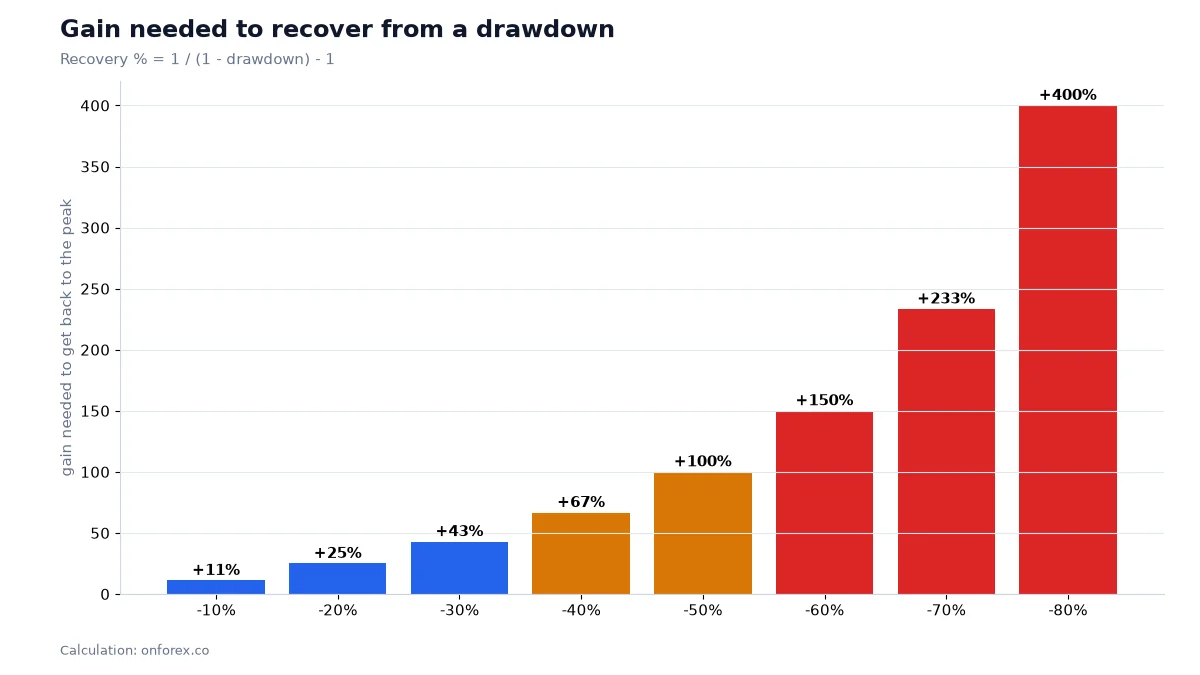
Losses need bigger gains to recover
A drawdown is measured from the lower balance on the way back up: -10% needs +11%, -20% needs +25%, -30% needs +43%, -50% needs +100%, and -80% needs +400%.
What compounding does trade by trade
With compounding (risk 1% of the current balance), a win of 1.5R adds 1.5% and a loss of 1R removes 1%. Take 10 wins and 10 losses:
- Compounding: 1.015^10 x 0.99^10 = 1.0496, a 4.96% gain.
- Fixed size (1% of the starting balance): 10 x 1.5% - 10 x 1% = 5.00% gain.
With an equal mix of wins and losses, compounding finishes very slightly behind, because each loss shrinks the base for the wins. Under compounding the final balance is the same whatever order those 20 trades come in, but the drawdown along the way is not: ten losses first means a 9.6% drawdown before the wins arrive, while alternating trades never falls far. Compounding pulls ahead only when wins clearly outnumber what the losses take away, which is another way of saying it needs a real, positive edge.
Our simulation: compounding vs fixed size
We simulated 20,000 accounts each trading the same kind of method for 200 trades: 45% winners at 1.5R, an expectancy of +0.125R per trade. Each account ran two ways: compounding risked 1% of the current balance, fixed risked 1% of the starting balance on every trade.
| Over 200 trades | Compounding | Fixed size |
|---|---|---|
| Median ending balance | 1.264x | 1.250x |
| 90th percentile (good paths) | 1.582x | 1.475x |
| 10th percentile (poor paths) | 1.010x | 1.025x |
| Median maximum drawdown | 11.8% | 10.4% |
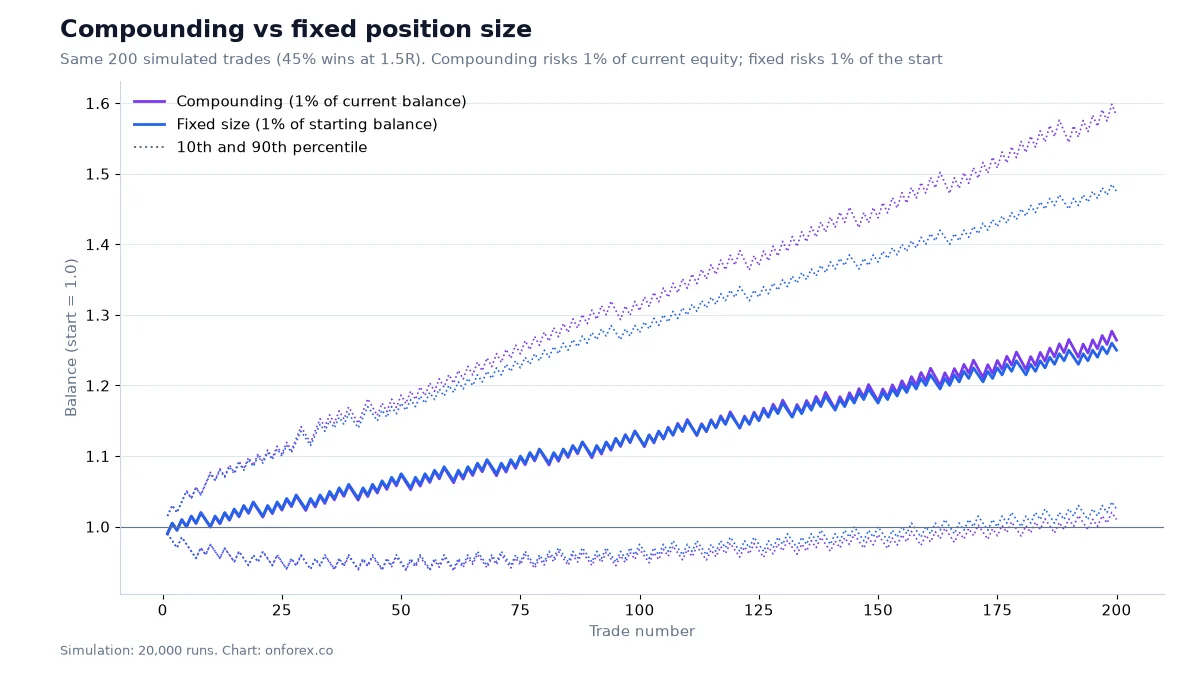
What this shows:
- At 1% risk over 200 trades, the gap is small. The medians differ by about 1.4% of the starting balance.
- Compounding magnifies the good paths. The 90th percentile is clearly higher because winning streaks raise the size of later trades.
- It also makes poor paths a little poorer and drawdowns a little deeper. The 10th percentile and the median drawdown are slightly worse.
- It never reaches zero through normal losses. Each loss is 1% of what is left, so even 11 losses in a row leave 0.99^11 = 89.5% of the balance. A fixed 1% of the start would have lost 11%. This is the real safety feature, but it does not cover gaps or slippage, where a stop fills beyond its price.
These are simulations, not forecasts. Real markets add spreads, swap, slippage and changing conditions, and an edge measured on past data can disappear. Our backtesting guide explains how easily a past edge is overstated.
How to apply compounding sensibly
- Decide your risk per trade first. Compounding is simply fixed-fractional sizing; 0.5% to 2% of current equity is a common range. See risk per trade.
- Recalculate lot size from the stop. Lots = risk amount / (stop in pips x pip value per lot). With 1,000 USD, 1% risk is 10 USD; with a 7.4-pip stop on EURUSD at 10 USD per pip per standard lot, that is 10 / 74 = 0.135, rounded down to 0.13 lots. See position sizing.
- Choose how often to update. Some traders recalculate before every trade; others use the balance at the start of each week. Weekly updates are simpler and react less to single trades.
- Round down. Small accounts hit the 0.01-lot minimum quickly, so compounding works in steps rather than smoothly.
- Account for withdrawals. Money you take out stops compounding, which is fine; a plan that never allows withdrawals is a plan built on the table, not on your life.
- Cut risk in drawdowns, never raise it to "catch up." Raising size after losses turns compounding into martingale. See drawdown and money management.
Common mistakes
- Planning from a monthly-return table. The table assumes the return; your trading decides it.
- Setting daily targets. They encourage overtrading and bigger size after losses.
- Raising risk per trade to compound faster. Larger risk adds volatility drag and deep drawdowns; at 5% risk our simulation showed a median maximum drawdown of 49.2%.
- Forgetting costs. Spreads, commissions and swap are taken from every trade and compound against you too.
- Confusing compounding with an edge. A method with negative expectancy still shrinks the account when you compound it; position sizing does not fix the method.
Our data
Compounding vs fixed: OnForex Monte Carlo simulation, 20,000 runs of 200 trades, 45% win rate, 1.5R reward, 1% risk of current or starting balance; no spreads, slippage or gaps. Risk-per-trade drawdown and losing-streak figures come from the same simulation framework described on our risk per trade page. Table values are exact calculations of the compound formula.
Related guides
- Risk per trade and position sizing
- Drawdown and the recovery table
- Martingale: why increasing size after losses fails
- Money management and risk reward ratio
- Backtesting to check whether there is an edge to compound
Practise on a demo account first
Try position sizing from your current balance on a free Exness demo account before you risk money. Forex and CFD trading carries a high risk of loss.
Continue to ExnessForex and CFD trading involves significant risk. You may lose your invested capital.
Risk warning: Forex and CFD trading carries a high risk of loss and may not be suitable for everyone. Compounding tables show arithmetic, not expected results, and simulations are not forecasts. This page is education, not investment advice.
Related Articles

Risk Per Trade in Forex: The 1-2% Rule and How to Size It
Risk per trade explained: the 1-2% rule, fixed fractional sizing, a step-by-step lot size calculation, Monte Carlo drawdown results and a careful look at Kelly.
Position Sizing in Forex: How to Calculate the Right Lot Size
Learn how to calculate position size in forex trading: risk-per-trade formulas, lot size calculators, Kelly criterion, and practical examples for any account size.

Forex Risk Management: How to Calculate Risk per Trade
Forex risk management step by step: calculate lot size from a 1% risk and a stop-loss, with USD 1,000 and USD 2,000 EUR/USD examples, drawdown and analytics.
Forex Lot Size 2026: What a Lot Is and How to Calculate It
Forex lot size explained. Standard, mini, and micro lots defined. Position size calculation formula with examples. Includes Exness calculator guide.
Forex Hedging Explained: Same-Account Hedges, Costs and Rules
How hedging works in forex: opposite positions in one account versus hedging with another pair, with a costed example of spread, swap and margin, and broker rules.
ATR Indicator: Formula, Settings and ATR Stop-Loss in Forex
ATR explained: how Average True Range is calculated with a worked example, the 14-period setting, ATR stops, position sizing and our stop-hit data.