ChatGPT Trading: How to Use AI Chatbots for Trade Analysis
ChatGPT trading explained: good and bad uses of AI chatbots for forex, six prompt templates, a journal example with the maths, and how to verify.
This site contains affiliate links. We may earn a commission if you sign up through our links. How we research
ChatGPT trading means using a general-purpose AI chatbot as a helper around your trading: explaining concepts, turning your rules into a checklist, summarising your journal and drafting code. It is useful for those jobs. It is not a price forecaster, and it can state wrong facts and numbers with complete confidence, so every output needs checking before you act on it.
Disclosure: OnForex may earn a referral commission from Exness links on this page. This is general education, not investment advice.
This guide is practical. It covers what chatbots do well for forex traders, what they should never be asked, six prompt templates you can copy, a worked journal example with the maths done by hand, and a verification routine. The same advice applies to ChatGPT, Claude, Gemini and other chatbots. For the bigger picture on machine learning, see our page on AI trading.
What an AI chatbot is, and why that matters for trading
A large language model (LLM) is a program trained on huge amounts of text to predict which words should come next. That is why a chatbot writes fluent explanations, translates, summarises and drafts code. It is also why it can be wrong: it is built to produce a plausible answer, not to look something up and confirm it.
Hallucination is the name for a confident answer that is simply made up. In trading it shows up as an invented central bank decision date, a wrong pip value, a price level that was never on the chart, or a backtest result the model never ran. Two stable facts help you stay safe:
- A chatbot without a browsing or data tool does not see live prices or today's news. If you ask for "the current EURUSD level" and it answers, it is guessing or repeating old text.
- A chatbot does not run your strategy unless it is connected to a code tool. When it says "this setup wins 62% of the time", that number has no source.
Good uses: where a chatbot saves time
1. Learning and explaining concepts
Ask it to explain a term at your level, give a different example, or quiz you. Then confirm the definition in a trusted source, because explanations of newer or niche ideas (for example order blocks or other Smart Money Concepts) vary a lot between websites and a chatbot may blend them.
2. Turning your rules into a written plan and checklist
Most traders carry rules in their head. A chatbot is good at forcing them onto the page: entry conditions, where the stop goes, when you skip a trade, daily loss limit. You supply the rules; it formats and spots gaps. A plan with a fixed risk per trade is the main thing worth writing down.
3. Reviewing your trade journal
This is the strongest use, because you give it real data and the task is arithmetic and sorting. It is covered in detail below.
4. Summarising news and the economic calendar
A chatbot can compress a long central bank statement into bullet points or list the questions a data release raises. Always read the source, because summaries can drop a key word ("less restrictive" versus "restrictive"). Dates and times of releases must be checked on the official calendar: see our economic calendar guide and news trading for how spreads and slippage behave around releases.
5. Writing indicator and backtest code
Pine Script (TradingView), MQL5 (MetaTrader) and Python are all within its reach. It can save an afternoon on boilerplate. The risk is in the details, covered in the code section below.
6. A second opinion on a chart you already marked
Mark your own levels first, then ask the chatbot to challenge them: "What would make this idea wrong?" Many chatbots can read an uploaded chart image, but they estimate prices from pixels. Check every level it quotes.
Bad uses: what not to ask
- "Will EURUSD go up tomorrow?" You will get a fluent answer with no information in it. We tested the proper version of this question with machine learning (see below) and it did not beat a simple baseline.
- "Give me a buy or sell signal." Even if the answer sounds sure, it has no live data and no accountability. See our note on trading signals.
- Position sizing you do not verify. Chatbots make arithmetic slips, and mixing up pip value or lot units is expensive. Do the sum yourself first (example below).
- Numbers it cannot see. Spread, swap, your broker's contract size, today's volatility: if you did not paste it in, it is a guess.
- Replacing your risk rules. The chatbot has no idea how much you can afford to lose.
Why price prediction is the wrong job: our test
We ran the question properly. Using 14 standard inputs (recent price changes in ATR units, RSI, distance from the 50 EMA, Bollinger %B, MACD, volatility, hour and weekday), we trained three mainstream machine-learning models to guess whether price would be higher 24 hours later, retraining month by month so that no answer leaked into training. First test month: January 2025; last: October 2026; about 11,000 test hours per market.
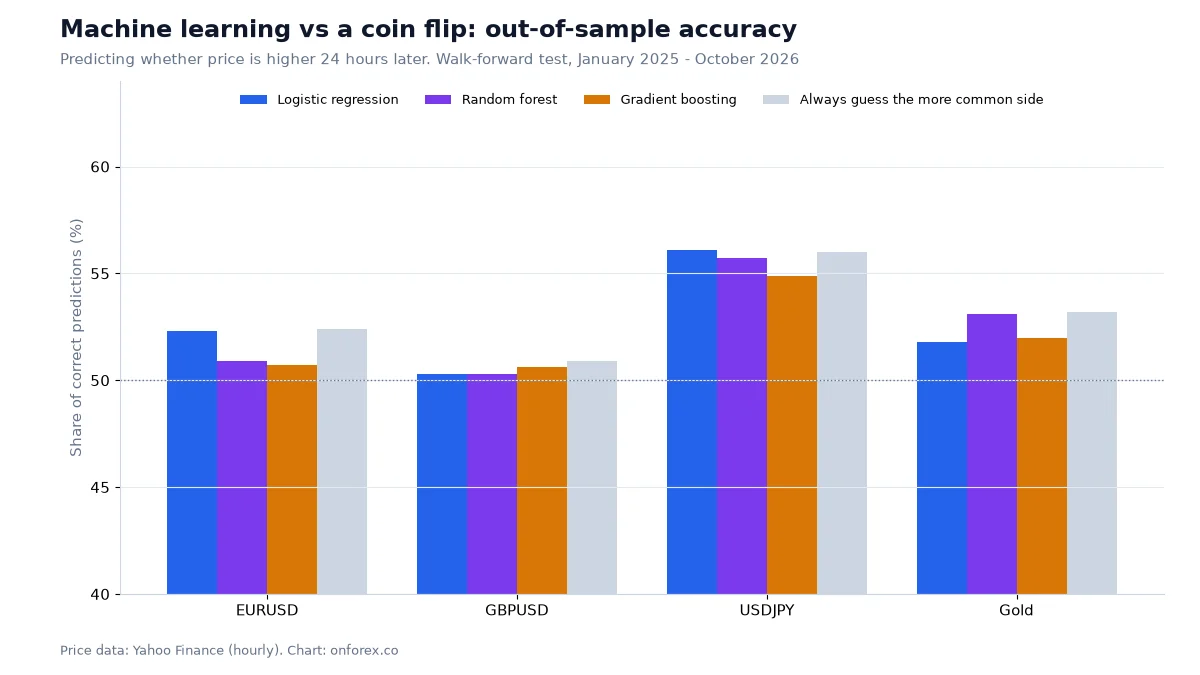
No model beat the simple baseline of "always guess the more common side" by more than 0.1 percentage point in any market, and the uncertainty range was about plus or minus 4.5 points. USDJPY looked like 55-56% accuracy, but that market rose on 56% of test hours and the models mostly said "up", so the score was just the trend. If specialised models fed numeric data could not do it, a chatbot guessing from text will not. Full details and the checklist for judging AI claims are on our AI trading page. (Source: OnForex walk-forward test on hourly prices from Yahoo Finance, January 2024 - October 2026; gold: June 2024 - October 2026, COMEX gold futures.)
Worked example: reviewing a trade journal
Keep a simple log: date, pair, setup name, session, result in R. One R is the amount you risked, so a trade that hits a 2R target is +2 and a stopped-out trade is -1. Results in R let you compare trades regardless of lot size.
Below is an illustrative example journal of eight trades (made-up numbers, not our results):
| # | Day | Pair | Setup | Session | Result (R) |
|---|---|---|---|---|---|
| 1 | Mon | EURUSD | OB retest | London | +2.0 |
| 2 | Tue | GBPUSD | Liquidity sweep | London | -1.0 |
| 3 | Wed | EURUSD | OB retest | New York | -1.0 |
| 4 | Thu | XAUUSD | FVG | New York | +1.5 |
| 5 | Thu | USDJPY | Breakout | Asia | -1.0 |
| 6 | Fri | EURUSD | OB retest | London | +2.0 |
| 7 | Mon | GBPUSD | Liquidity sweep | New York | -1.0 |
| 8 | Tue | XAUUSD | FVG | London | +0.5 |
(OB = order block, FVG = fair value gap.) Here is the arithmetic, which you should be able to reproduce by hand:
- Total: 2.0 - 1.0 - 1.0 + 1.5 - 1.0 + 2.0 - 1.0 + 0.5 = +2.0R
- Win rate: 4 winners of 8 = 50%
- Average result per trade: 2.0 / 8 = +0.25R
- Average winner: (2.0 + 1.5 + 2.0 + 0.5) / 4 = +1.5R; average loser: -1.0R
- Longest losing streak: 2 trades
- By setup: OB retest +3.0R over 3 trades; FVG +2.0R over 2; liquidity sweep -2.0R over 2; breakout -1.0R over 1
- By session: London +3.5R over 4 trades; New York -0.5R over 3; Asia -1.0R over 1
If you risk 1% per trade on a USD 1,000 account, 1R is USD 10, so the eight trades made USD 20, or 2% of the account, before any commission or swap.
A good chatbot summary repeats these figures and then adds a warning: eight trades is far too few to conclude that the sweep setup "doesn't work" or that London is "better". With 2 or 3 trades per group, one trade changes the answer. Look for a sample of at least several dozen trades per setup before acting on a pattern, and treat anything smaller as a question to track, not a rule. A good use of the chatbot is to find what to track next, such as whether your losers cluster at the end of the day.
Now paste the same data and ask the chatbot to compute the figures. If its numbers differ from the list above, you have just seen why you verify.
Six prompt templates
Copy these (the sixth is optional), replace the bracketed parts and keep the "check" step.
1. Turn your rules into a trading plan
Here are my trading rules in rough notes: [paste notes].
Rewrite them as a one-page plan with: markets and timeframe, setup conditions,
entry, stop-loss placement, target, risk per trade, daily loss limit,
and conditions where I do not trade. List any rule that is vague or
contradicts another rule. Do not add new rules.
Check: did it quietly add or change a rule? Compare line by line with your notes.
2. Review a trade journal
Below is my trade journal as CSV (columns: date, pair, setup, session, result_in_R).
Calculate: number of trades, win rate, average R, average winner, average loser,
longest losing streak, and totals by setup and by session.
Show the formulas you used. Then list three questions the data raises,
and say how many trades I would need before trusting each pattern.
[paste CSV]
Check: recompute two or three figures in a spreadsheet. Chatbots slip on sums.
3. Challenge a trade idea
My idea: [pair, timeframe, direction, entry, stop, target, reason].
Act as a sceptical reviewer. Give the three strongest reasons this trade
could fail, the news or session risks, and what evidence would make me
cancel it. Do not tell me to take or skip the trade.
Check: are the risks real for your pair and time of day? Verify event times on the economic calendar.
4. Summarise a central bank statement
Summarise the following statement in 6 bullet points. Mark any wording that
changed compared with the previous statement I paste after it.
Do not predict market reaction. [paste both statements]
Check: read the original sentences behind each bullet.
5. Draft a backtest or indicator
Write [Pine Script v5 / MQL5 / Python] code for this rule: [exact rule].
Use only data available at the close of each bar, so there is no look-ahead.
Include 1.2 pips of cost per trade. Explain each block in plain language
and list any assumption you made.
Check: see the next section.
6. Post-trade review (optional)
Here are my notes on a losing trade: [what I planned, what I did, what happened].
Sort the causes into: bad idea, good idea but poor execution, or normal loss
within plan. Ask me questions if my notes are not enough.
Check: be honest in the notes. The chatbot can only sort what you tell it. For the emotional side, see trading psychology.
Using it for code without fooling yourself
Code from a chatbot often compiles and runs. That does not mean the result is true. Before you believe any backtest, check:
- Look-ahead bias. Does a signal use the high, low or close of the bar it trades on, or any future value? A common bug is reading the close of the current bar and filling at its open.
- Costs. Is spread, commission and slippage included? A strategy with a small edge often disappears after costs.
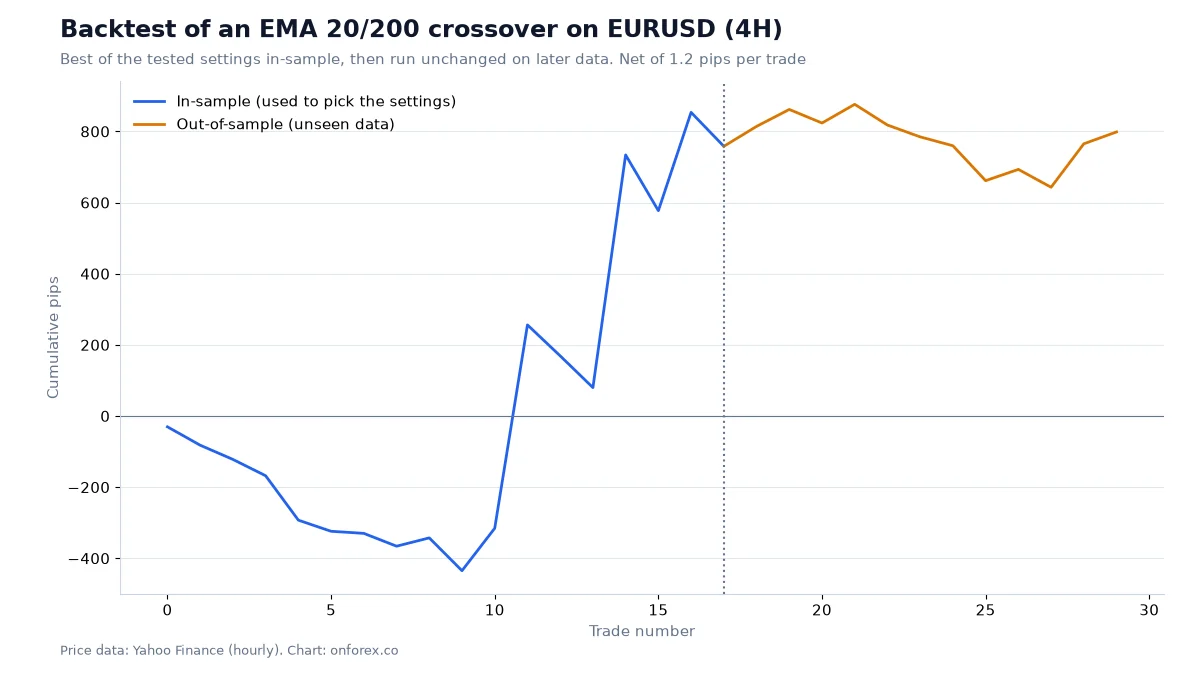
- Overfitting. Chatbots love to add parameters. The more settings you tune, the more likely you are fitting noise. We tested 39 EMA settings on EURUSD 4H: the best one made +758 pips in-sample and +40 out-of-sample. Read more in our backtesting guide.
- Trade count. A great curve from 12 trades is an anecdote.
- Behaviour you did not ask for. Look for hidden averaging down or increasing lot size after a loss (see martingale).
Then run the finished script on a demo account for several weeks before any real money, and keep position size small when you go live.
Do the position-size sum yourself
If a chatbot gives you a lot size, redo it. The formula is: lots = (account x risk %) / (stop in pips x pip value per lot). Example: USD 1,000 account, 1% risk = USD 10. Entry 1.1000, stop 1.0980 = 20 pips. On EURUSD, one pip on a standard lot (100,000 units) is about USD 10, so the stop costs USD 200 per lot. USD 10 / USD 200 = 0.05 lots. Compare with the tool's answer; if it differs, find out why. More in position sizing and pip value.
Privacy and safety
- Never paste passwords, API keys, account login details, account numbers, ID documents or personal data.
- Strip what the task does not need. For a journal review, dates, pair, setup and R are enough.
- Check the tool's data-use and retention settings before uploading a broker statement.
- Be wary of people who offer a "ChatGPT trading bot" or ask for your account access. See AI trading bots.
Common mistakes
- Treating fluency as accuracy. A confident tone says nothing about correctness.
- Asking for predictions instead of analysis of your own data.
- Accepting code without a test on data it was not tuned on.
- Over-reading small samples. Eight trades cannot rank your setups.
- Letting the chatbot decide risk. Your stop and size come from your plan.
A simple verification routine
For anything a chatbot says that could cost money: find the claim in a primary source (central bank, exchange, broker contract specifications); recompute any maths yourself; test code on unseen data, then on a demo account; and write your stop and your reason for exiting before you enter. Remember that spreads widen around news and market opens, and stops can fill worse than planned (slippage), which a chatbot cannot account for unless you tell it.
Related guides
- AI trading: what machine learning can and cannot do
- AI trading bots: how to check the claims
- Backtesting without fooling yourself
- Risk per trade and position sizing
- Economic calendar and news trading
Practise on a demo account first
Test any idea or tool on a free Exness demo account before you risk money. Forex and CFD trading carries a high risk of loss.
Continue to ExnessForex and CFD trading involves significant risk. You may lose your invested capital.
Risk warning: Forex and CFD trading carries a high risk of loss and may not be suitable for everyone. AI chatbots can produce wrong information. Nothing here is investment advice, and past or simulated results do not guarantee future results.
Related Articles
How to Read Forex Charts: Complete Beginner's Guide 2026
Learn how to read forex charts step by step. Understand candlesticks, trend lines, support and resistance, and key chart patterns with practical examples.
Technical Analysis in Forex: A Practical Guide With Data
Technical analysis in forex explained: trends, support and resistance, indicators, candlesticks and SMC, plus our own test of whether the signals beat chance.
Multiple Time Frame Analysis: Top-Down Analysis in Forex
Multiple time frame analysis explained: how top-down analysis works, which timeframes to combine, a step-by-step routine, and what our trend data showed.
Forex Candlestick Patterns: 16 Key Patterns and How to Use Them
Forex candlestick patterns in one table: what 16 key patterns show, the confirmation to wait for, entry and stop rules and why patterns alone are weak.
Forex Order Types: Market, Limit, Stop and OCO Explained
Forex order types explained: market, buy limit, sell limit, buy stop, sell stop, stop loss, take profit, trailing stop, OCO and slippage, with a EURUSD example.
Forex Risk Management: How to Calculate Risk per Trade
Forex risk management step by step: calculate lot size from a 1% risk and a stop-loss, with USD 1,000 and USD 2,000 EUR/USD examples, drawdown and analytics.