AI Trading in Forex: What AI Can and Cannot Do (Tested)
AI trading in forex explained: what machine learning and chatbots can do, and our walk-forward test of three models on 4 markets that did not beat a simple baseline.
This site contains affiliate links. We may earn a commission if you sign up through our links. How we research
AI trading means using software that learns from data, or generates text and code, to help analyse markets or place trades. In our own walk-forward test of three machine learning models on EURUSD, GBPUSD, USDJPY and gold, none predicted next-day direction better than simply guessing the more common side, so AI is best treated as a research and productivity tool, not a forecast.
Disclosure: OnForex may earn a referral commission from Exness links on this page. This is general education, not investment advice.
This guide explains what people mean by AI in forex, where it genuinely helps, why predicting price is so hard, what our test found, and a checklist for judging any claim about AI trading. It is written for retail traders who keep seeing ads for "90% accurate AI".
What does "AI trading" actually mean?
The label covers three very different things, and mixing them up is how most confusion starts.
| Type | How it works | Example |
|---|---|---|
| Rules-based algorithm or EA | A person writes fixed rules; the software only executes them | Buy when the 20 EMA crosses above the 200 EMA, stop 1.5 ATR away |
| Machine learning model | The software fits its own rules from historical data and uses them on new data | A model that outputs the probability that price is higher tomorrow |
| Large language model (LLM) | Generates text and code from a prompt; it does not see live prices unless connected to a data tool | A chatbot that explains a concept or writes indicator code |
An EA (Expert Advisor) is a program that trades automatically on MetaTrader 4 or 5. Most products marketed as "AI EAs" are the first type with a new label. A machine learning model is a genuine second type, but it is only as good as its data, its testing and its costs. An LLM is a writing and coding assistant, not a market oracle. We cover chatbots in how to use ChatGPT for trade analysis and the product side in AI trading bots and how to spot scams.
Where AI is genuinely useful
- Text and news. Models can summarise long central bank statements or sort headlines by topic much faster than a person. You still need to read the source, because a summary can drop a key word.
- Pattern search in large data sets. Institutions screen thousands of instruments and many data types. A retail trader with hourly prices on four pairs is in a very different position.
- Execution and risk monitoring. Splitting large orders, tracking exposure and flagging unusual behaviour are well suited to software.
- Saving time. Writing a first version of Pine Script or Python code, cleaning a trade journal, drafting a checklist, or explaining a term you do not know. This is where most retail traders will see real value.
- Reviewing your own behaviour. A model can count how often you moved a stop or traded outside your plan, which is hard to see yourself. See trading psychology.
None of these requires the AI to predict price.
Why predicting price is so hard
- Noise. Over a day, most of what moves a major pair is random-looking flow. A model can find shapes in noise that look real in the past and vanish later.
- Changing regimes. A relationship that held during a rate-hiking cycle may stop when policy changes. The model keeps using the old rule.
- Competition. When an inefficiency is found and traded, it shrinks. Whatever is easy to find in public price data is mostly already being traded away.
- Costs. Spread, slippage and swap are paid on every trade. A tiny edge before costs can be a loss after them. Spreads also widen around news and market opens.
- Few independent observations. Hourly data looks huge, but overlapping windows are not independent. More on this in the test below.
Our test: can standard machine learning predict the next day?
We tested this directly, with the same method a serious researcher would use.
Question. Will price be higher 24 hours later than it is now (up or down)?
Inputs (14, all known at the time). Price change over the last 1, 3, 6, 12, 24 and 48 hours (in ATR units), RSI(14), distance from the 50 EMA, Bollinger %B, MACD histogram, ATR as a percentage of price, hour of day and weekday.
Models. Logistic regression (simple and linear), random forest and gradient boosting (two popular tree-based models).
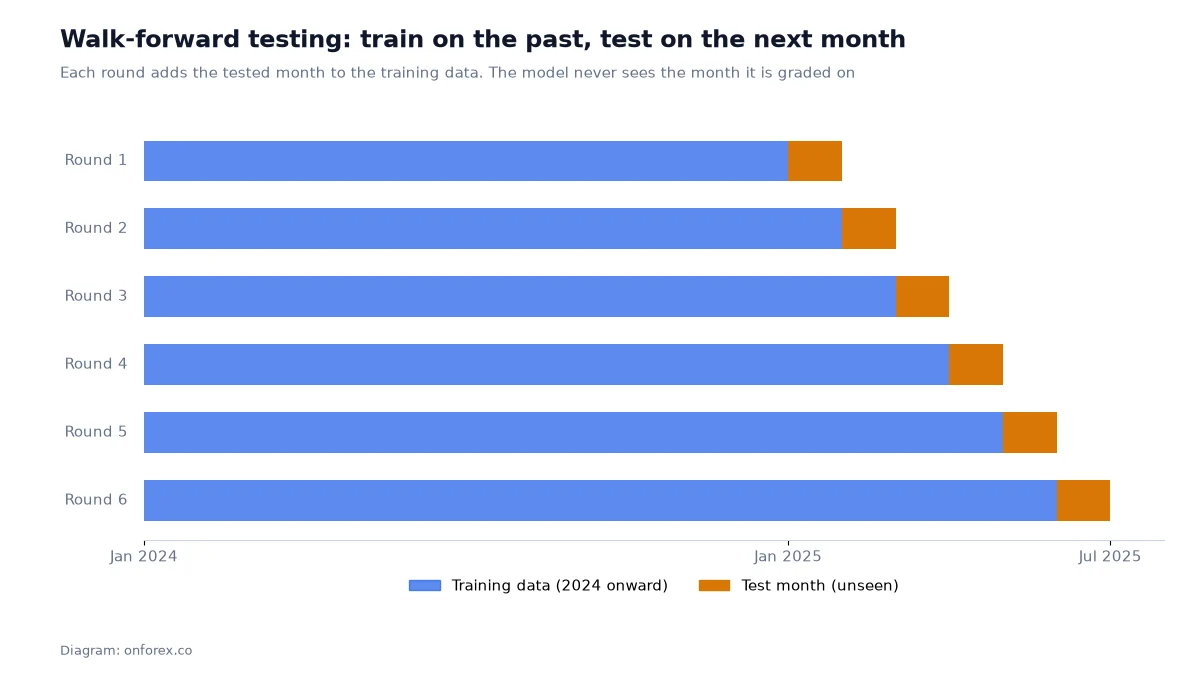
Walk-forward method. For each month we trained on all data before it, predicted every hour of that month, then added the month to the training data and repeated. The first test month was January 2025 and the last was October 2026: 22 months, about 11,000 test hours per market. We left a 24-hour gap so that no answer leaked into the training data.
Result 1: accuracy against the right baseline
| Out-of-sample accuracy | EURUSD | GBPUSD | USDJPY | Gold |
|---|---|---|---|---|
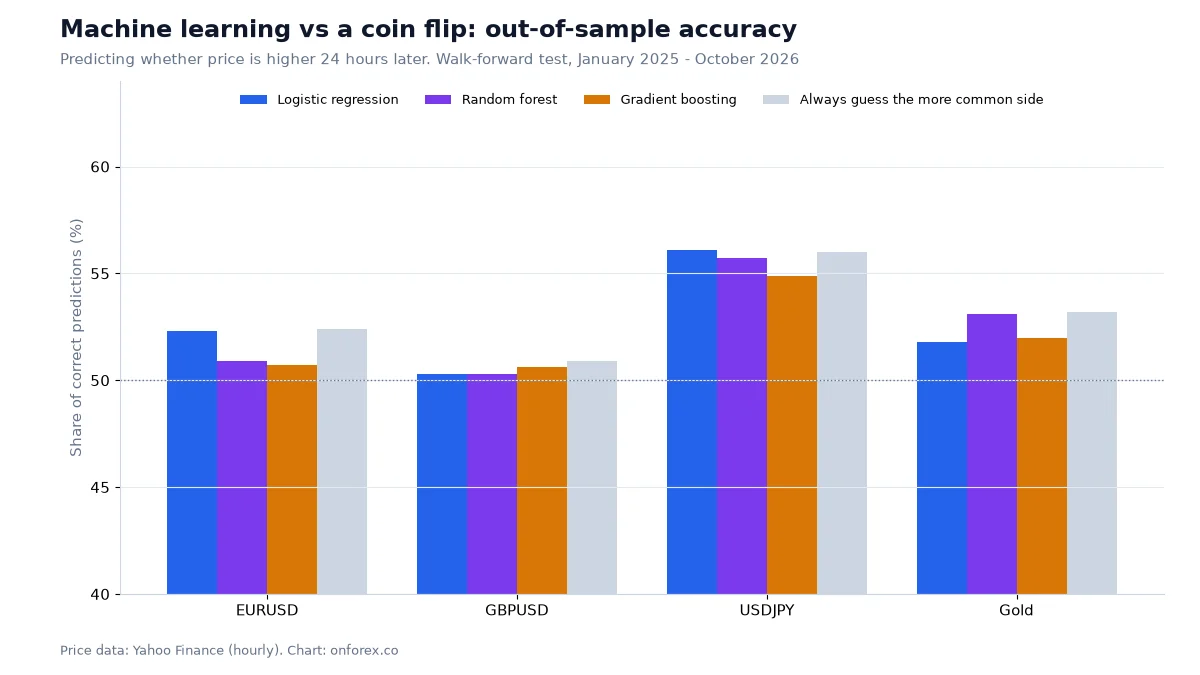
| Share of hours price was higher 24h later | 47.6% | 50.9% | 56.0% | 53.2% |
| Baseline: always guess the more common side | 52.4% | 50.9% | 56.0% | 53.2% |
| Logistic regression | 52.3% | 50.3% | 56.1% | 51.8% |
| Random forest | 50.9% | 50.3% | 55.7% | 53.1% |
| Gradient boosting | 50.7% | 50.6% | 54.9% | 52.0% |
No model beat the "always guess the more common side" baseline by more than 0.1 percentage point in any market. The 95% range of uncertainty is about plus or minus 4.5 points, because overlapping 24-hour windows give roughly 470 independent days, not 11,000 hours. In plain terms, the differences between the models and the baseline in that table are within the noise.
Result 2: the USDJPY trap
USDJPY looks impressive at 55-56%. But the models said "up" 72-88% of the time in a market that rose on 56% of days, so the accuracy is just the trend. As a control we trained the same kind of model on randomly shuffled answers, so it could learn nothing, and tested it on 2026. It scored 54.9% on EURUSD, 48.3% on GBPUSD, 61.3% on USDJPY and 48.1% on gold. A model that learned nothing posted 61% in a trending market.
This is the single most common way that "AI accuracy" is inflated: no comparison with a baseline.
Result 3: overfitting
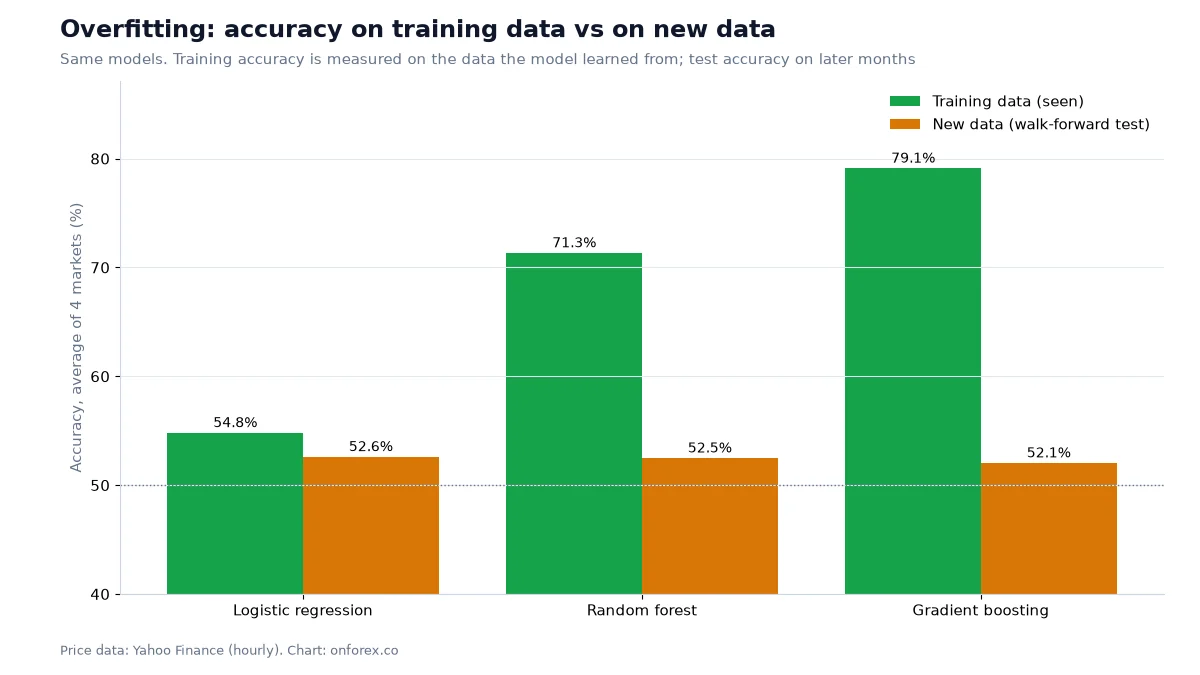
Overfitting means a model memorises noise in its training data instead of learning something that repeats. We compared accuracy on the data each model had been trained on with its accuracy on new data (average of four markets).
| Model | Accuracy on training data | Accuracy on new data |
|---|---|---|
| Logistic regression | 54.8% | 52.6% |
| Random forest | 71.3% | 52.5% |
| Gradient boosting | 79.1% | 52.1% |
The more flexible the model, the better it remembered the past and the worse the gap. All three ended at about 52% on new data. A vendor showing only the "training" or "backtest" number is showing you the left column.
Result 4: does it make money after costs?
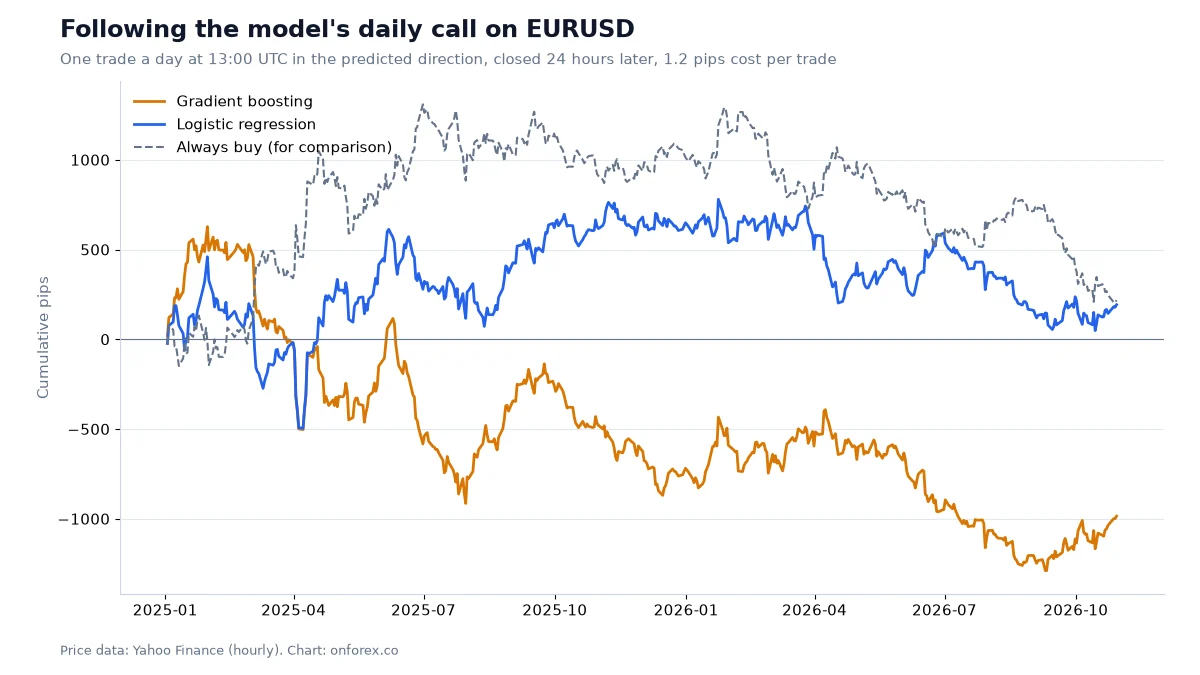
We also ran a simple trading check: one trade per day at 13:00 UTC in the predicted direction, closed 24 hours later, with a cost of 1.2 pips per trade (USD 0.30 for gold). That gave about 470 trades per market.
| Net result after costs | Logistic | Random forest | Gradient boosting | Always buy |
|---|---|---|---|---|
| EURUSD (pips) | +192 | -909 | -986 | +218 |
| GBPUSD (pips) | -167 | -863 | -691 | +424 |
| USDJPY (pips) | +1,367 | +1,322 | +2,940 | -504 |
| Gold (USD) | +344 | -624 | +1,246 | +1,188 |
Win rates sat between 48% and 57%. The sign flips between models whose accuracy is almost identical, and between markets. If we picked the "best" model after seeing this table, that choice would itself be overfitting; the lesson from backtesting applies here too. Gold's "always buy" result reflects gold's strong rise over the period, not skill.
What the test does and does not show
With standard indicator inputs, mainstream machine learning models did not predict the next day's direction better than simple baselines. That does not prove AI can never help. Institutions use other data, faster horizons and cheaper execution than we modelled. What it shows is why a claim of "90% accurate AI" deserves checking, and how to check it.
How to evaluate any claim about AI trading
Use this checklist on any product, course or signal service.
- Was it tested out of sample? Look for walk-forward or a separate unseen period, not just a backtest on the data used to build it. In our backtesting example, the best of 39 EMA settings made +758 pips in-sample and +40 out-of-sample.
- What is the baseline? Accuracy, win rate and profit must be compared with a simple alternative such as always buying, or a shuffled-label model.
- Are costs and slippage included? Ask for spread, commission, swap and slippage assumptions per trade.
- How many independent trades? Fewer than 100 trades tells you very little. Hourly predictions overlap, so count trades or days, not rows of data.
- Is there a live track record? A verified live account over 12 months or more, from a third party, beats any screenshot.
- What is the maximum drawdown? Return without drawdown is not information. See drawdown.
- Is the logic visible? Hidden martingale or grid behaviour can make a strategy win often until it fails once. See martingale.
- Who controls the money? Never give anyone access to your trading login or let them trade your account.
How a retail trader can use AI sensibly
- Ask a chatbot to explain concepts, then check them against a reliable source.
- Turn your own rules into a written plan and a pre-trade checklist; our position sizing and risk management guides help you fix the numbers first.
- Have it draft test code for TradingView (Pine Script), MetaTrader (MQL5) or Python, then test the code yourself and look for look-ahead bias, where a rule accidentally uses information from the future.
- Use it to review a trade journal for patterns in your mistakes.
- Keep your risk fixed per trade and judge results in R, not in excitement. See risk per trade.
- Treat any output as a hypothesis to test, not a trade idea to follow. For the technical analysis basics those tools build on, see technical analysis.
Common mistakes
- Trusting accuracy without a baseline. The USDJPY example shows how.
- Judging by a backtest. Memorised history is not skill.
- Paying for "AI" labels. Check the rules, the record and the costs instead.
- Letting AI size your positions. Chatbots make arithmetic errors and cannot see your account.
- Increasing risk after a good run. Luck looks like skill in short samples; see the drawdown and risk simulations in risk per trade.
Our data
All test results use the OnForex walk-forward test on hourly prices from Yahoo Finance, January 2024 - October 2026 (gold: June 2024 - October 2026, COMEX gold futures), with test months from January 2025 to October 2026. The trading check uses one trade per day at 13:00 UTC, closed 24 hours later, with a cost of 1.2 pips (gold USD 0.30). The results describe these three models, these inputs and this period; they are not a forecast and not a recommendation of any model.
Related guides
- How to use ChatGPT for trade analysis
- AI trading bots: how to check the claims and avoid scams
- Backtesting a trading strategy
- Technical analysis and trading psychology
Practise on a demo account first
Test any idea or tool on a free Exness demo account before you risk money. Forex and CFD trading carries a high risk of loss.
Continue to ExnessForex and CFD trading involves significant risk. You may lose your invested capital.
Risk warning: Forex and CFD trading carries a high risk of loss and may not be suitable for everyone. Past results, whether real, backtested or produced by a model, do not guarantee future results. This page is education, not investment advice.
Related Articles
How to Backtest a Trading Strategy (Forex Backtesting Guide)
Forex backtesting step by step: manual and automated methods, the metrics that matter, sample size, costs, and our EMA crossover test that shows overfitting.
Forex Candlestick Patterns: 16 Key Patterns and How to Use Them
Forex candlestick patterns in one table: what 16 key patterns show, the confirmation to wait for, entry and stop rules and why patterns alone are weak.
Price Action Trading: How to Read Raw Charts Like a Pro
Learn price action trading from scratch in 2026. Master candlestick patterns, key support and resistance levels, and how to trade forex without lagging indicators.
Smart Money Concepts (SMC) Explained: ICT Basics and Our Data
Smart money concepts (SMC) explained: what ICT terms like BOS, order block and FVG mean, how a top-down read works, and what our own price data shows.
Is Exness Involved with Russia? What the Footer and Help Say
Is Exness involved with Russia? Exness names Russia among places it does not serve. What that means for residents, how residence is decided and scam warnings.
Exness Education: Webinars, Tutorials and Demo Account (2026)
What Exness offers for learning: webinars, video tutorials, articles, analysis tools and a demo account, what it does not offer, and outside resources.