Wyckoff Method: Accumulation, Spring and Distribution
Wyckoff method explained: the three laws, accumulation and distribution phases, the Wyckoff spring and upthrust, and how often springs led to markup in our data.
This site contains affiliate links. We may earn a commission if you sign up through our links. How we research
The Wyckoff method is a way of reading charts that describes markets as moving between trading ranges (accumulation before a rise, distribution before a fall) and trends (markup and markdown). Its best-known event is the Wyckoff spring: a dip below the range low that closes back inside, read as a shakeout before a rally. On our mechanical test of four markets, though, a spring led to the top of the range first in only about 1 in 5 cases, so Wyckoff works better as a map of phases than as a trigger.
Disclosure: OnForex may earn a referral commission from Exness links on this page. This is general education, not investment advice.
This guide covers the three Wyckoff laws, the accumulation and distribution schematics with each event explained, how springs and upthrusts relate to liquidity sweeps, how to plan a trade around a range with real sizing, the volume problem in forex, and what our own data says about springs and upthrusts.
What is the Wyckoff method?
Richard D. Wyckoff was an American trader and author active in the early 1900s. He watched how large operators moved stock prices and turned what he saw into a set of principles. One of his teaching tools was the Composite Man (or composite operator): imagine that all the large money in a market is one person who quietly buys in ranges at low prices, pushes price up, sells in ranges at high prices, and pushes price down. The Composite Man is a teaching device, not a claim that one person controls the market.
The method has three layers:
- Three laws that explain why price moves.
- Schematics that describe what a trading range looks like before a trend starts.
- A step process for choosing what to trade and when.
The vocabulary below is the part most forex traders use today.
The three Wyckoff laws
| Law | What it says | How traders use it |
|---|---|---|
| Supply and demand | Price rises when demand exceeds supply and falls when supply exceeds demand | Compare up-moves with down-moves: which side moves faster and further? |
| Cause and effect | A trend (effect) needs a period of building (cause), usually a trading range | A longer, wider range is taken as the base for a larger move. Some traders size targets with point-and-figure counts |
| Effort vs result | Volume (effort) should agree with price movement (result) | A big volume bar with little price progress hints that the other side is absorbing the move |
The first law is the same idea behind supply and demand zones. The third law needs reliable volume, which is the weak point in forex (see below).
The market cycle: four phases
Wyckoff describes a repeating cycle:
- Accumulation: a sideways range after a decline.
- Markup: an uptrend out of that range.
- Distribution: a sideways range after a rise.
- Markdown: a downtrend out of that range.
In market structure terms, markup is a run of higher highs and higher lows, markdown is a run of lower highs and lower lows, and the ranges are where structure becomes unclear.
Wyckoff accumulation, phase by phase
Accumulation is described in five phases, A to E, with named events.
| Phase | Event | What it looks like |
|---|---|---|
| A: stopping the fall | PS (preliminary support) | The first sign of buying after a long decline: a bounce, often on rising volume |
| SC (selling climax) | A sharp, wide-range drop that marks the low of the range | |
| AR (automatic rally) | The bounce after the SC. Its high becomes the top of the range | |
| ST (secondary test) | Price comes back toward the SC low, usually with less momentum | |
| B: building the cause | Range trading | Price swings between the AR high and SC low, sometimes for a long time |
| C: the test | Spring | A drop below the range low that closes back inside |
| Test | A second, calmer dip toward the spring area that holds above the spring low | |
| D: strength appears | SOS (sign of strength) | A strong rally to or above the top of the range |
| LPS (last point of support) | A pullback after the SOS that holds above the range or near its top | |
| E: markup | Trend | Price leaves the range and trends higher |
Not every range has a spring. Wyckoff writers themselves say accumulation can end without one, which is one reason the schematic should be used as a description, not a checklist.
Wyckoff distribution, phase by phase
Distribution is the mirror image at the top.
| Phase | Event | What it looks like |
|---|---|---|
| A | PSY (preliminary supply) | First heavy selling after a long rise |
| BC (buying climax) | A sharp, wide-range rise that marks the top of the range | |
| AR (automatic reaction) | The drop after the BC. Its low becomes the bottom of the range | |
| ST (secondary test) | Price comes back toward the BC high, usually with less momentum | |
| B | Range trading | Swings between the BC high and AR low |
| C | UTAD (upthrust after distribution) | A push above the range high that closes back inside |
| D | SOW (sign of weakness) | A strong drop to or below the bottom of the range |
| LPSY (last point of supply) | A weak rally after the SOW that fails below the range or near its bottom | |
| E | Markdown | Price leaves the range and trends lower |
The Wyckoff spring and the liquidity sweep
A spring is a dip below an obvious range low. Many traders keep their stops just below that low, and breakout sellers place sell-stop orders there. When price trades through, those orders fill; if buyers then push price back inside the range quickly, the move has "used up" the sellers.
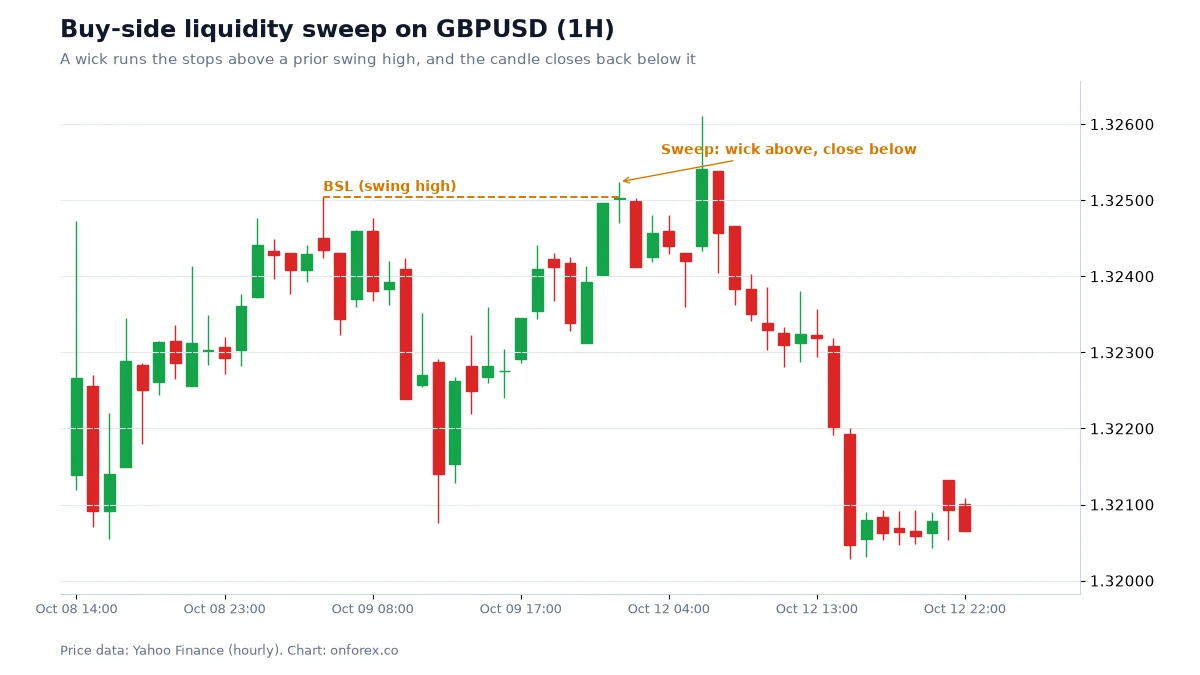
That is exactly what Smart Money Concepts calls a sell-side liquidity sweep: price takes the SSL (sell-side liquidity, the stops under a low) and closes back inside. An upthrust or UTAD is the mirror, a buy-side liquidity (BSL) sweep above a range high. See liquidity sweep for the SMC version and our data on it.
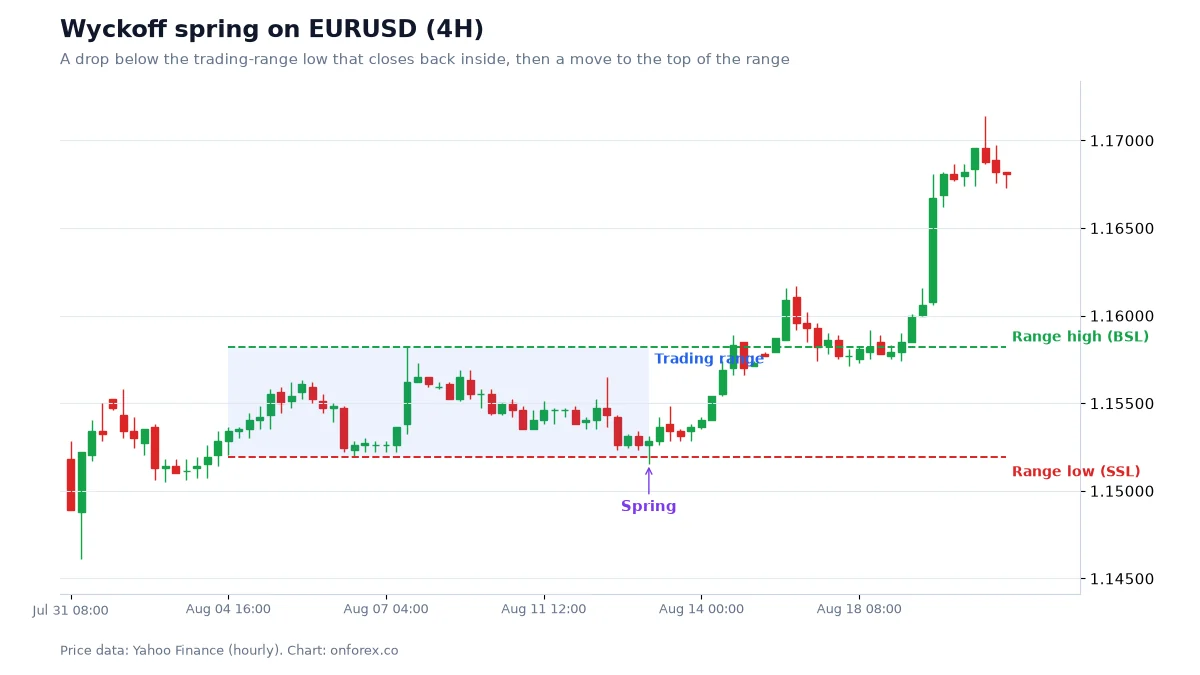
On this chart the range runs from about 1.152 to about 1.158 from 4 August. On 13 August a candle's wick dipped below the range low and the candle closed back inside. Over the next days price climbed to the top of the range, closed above it (a sign of strength), pulled back toward the old range high, which held (a possible LPS), and then moved up toward 1.170. This is the textbook sequence. As the data section shows, it is not the usual outcome.
How to trade a Wyckoff range: a step process
Wyckoff's own five steps were about choosing stocks. Adapted to forex, a practical version is:
- Identify the background trend on a higher time frame. Is the range forming after a decline (possible accumulation) or after a rise (possible distribution)? See multi-timeframe analysis.
- Mark the range: the climax low and the automatic rally high for accumulation, or the reverse for distribution.
- Wait for phase C (a spring or UTAD), but do not enter on it alone.
- Wait for confirmation: a test that holds above the spring low, or a sign of strength back to the range high. Many traders enter on the test or on the LPS after the SOS.
- Place the stop beyond the extreme of the spring or upthrust, with a buffer.
- Set the target at the opposite side of the range first; the trend beyond it is a bonus, not the plan.
Worked example with round numbers
These are rounded figures close to the chart above, used to show the arithmetic, not a trade we took.
- Range low about 1.1520, range high about 1.1580 (60 pips).
- After the spring, a test holds and you plan a buy at 1.1530.
- Stop below the spring low with a buffer: 1.1500, so 30 pips of risk.
- First target: the range high at 1.1580, 50 pips away. That is 50 / 30 = about 1.7R.
R is the amount you risk: hitting the stop loses 1R. With a USD 1,000 account and 1% risk (USD 10), and EURUSD pip value of USD 10 per standard lot: lots = 10 / (30 x 10) = 0.03 lots (0.033 rounded down). See position sizing and risk-reward ratio.
A stop placed only a pip or two under the spring low is likely to be hit by ordinary noise. Around news and the weekly open, spreads widen and stops can fill worse than set (slippage). See stop loss.
The volume problem in forex
Wyckoff built his method on exchange volume, where every trade is reported. Spot forex trades over the counter across many banks and brokers, so there is no single volume figure. What MT4, MT5 and most charting tools show for forex is tick volume: the number of price updates in each bar at that broker.
Tick volume tends to rise when the market is busy, so it is not useless. But it measures activity, not traded size, and it differs between brokers. This makes the effort vs result law much weaker in forex. Many forex Wyckoff traders lean on price action instead: wide-range candles for effort, and how far price actually travels for result. If you want real exchange volume, currency futures on regulated exchanges publish it, but those are a different product from spot forex.
Our data: how often did springs and upthrusts work?
We tested a mechanical version on 4H candles. A trading range was a period where the prior 40 bars spanned no more than 6 x ATR(14). ATR (average true range) is the average candle range of the last 14 bars. A spring was a low below the range low that closed back inside; an upthrust was the mirror at the range high. The outcome: within 60 bars, did price reach the opposite edge of the range before trading beyond the spring (or upthrust) extreme? Source: OnForex analysis of hourly prices from Yahoo Finance, January 2024 - October 2026 (gold: June 2024 - October 2026, COMEX gold futures), resampled to 4H.
| EURUSD | GBPUSD | USDJPY | XAUUSD | |
|---|---|---|---|---|
| Springs found | 35 | 35 | 31 | 25 |
| Spring reached the range high first | 20.0% | 17.1% | 19.4% | 12.0% |
| Upthrusts found | 30 | 34 | 35 | 32 |
| Upthrust reached the range low first | 26.7% | 17.6% | 8.6% | 6.2% |
How to read it honestly:
- The textbook path was the minority. A spring followed by a run to the top of the range happened in only 12% to 20% of cases. In the rest, price more often came back and broke the spring low, or stayed inside the range without reaching either side.
- Upthrusts on USDJPY and gold were weaker still (8.6% and 6.2%). Both markets drifted upward over this period (in our data, price was lower 12 hours later in only 45.8% and 45.5% of hours), so fading a push above a range high meant trading against the larger trend.
- Samples are small. 25 to 35 events per market means each figure could move a lot with a few more cases.
- This test is stricter than how most Wyckoff traders work. We entered nothing; we only asked whether the opposite edge came first. It does not include a confirmed test or a sign of strength. That is the point: the spring on its own was not enough, which is why the method asks for confirmation.
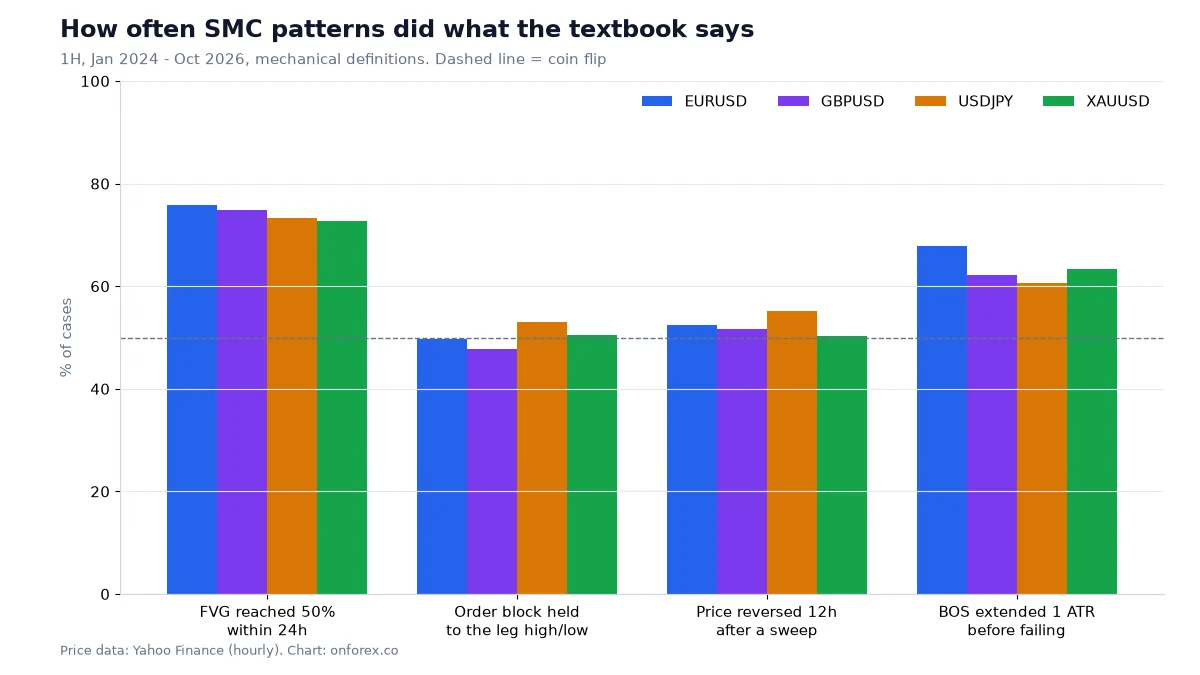
Our separate test of 1H liquidity sweeps points the same way: 12 hours after a sweep, price was on the reversal side 50.2% to 55.1% of the time, against a baseline of 45.5% to 49.8% for price being lower 12 hours later at any hour. A sweep, like a spring, marks a location worth watching, not a reversal you can count on.
Common mistakes
- Labelling every range as accumulation. Whether a range was accumulation or distribution is only clear after the breakout. Keep both possibilities open.
- Buying the spring candle itself. Our data shows most springs did not lead straight to the range high. Wait for a test or a sign of strength.
- Forcing every event onto the chart. Real ranges skip events, repeat tests, or break out without a spring.
- Over-trusting tick volume. In forex, volume is a rough activity gauge, not proof of absorption.
- Ignoring the higher time frame. An accumulation pattern on 4H inside a strong daily downtrend often turns into a pause before more downside.
- No fixed stop. If the spring low breaks, the accumulation reading is wrong. Exit and reassess.
How to practise
Find ten past trading ranges on one market and label the events you see, using only data up to each point. Record what happened after each spring or upthrust: range high first, spring low broken first, or neither. Compare with the table above, then forward-test your rules on a demo account. Related reading: Smart Money Concepts, breakout strategy, support and resistance and price action.
Practise on a demo account first
Mark structure, FVGs and stops on a free Exness demo account before you risk money. Forex and CFD trading carries a high risk of loss.
Continue to ExnessForex and CFD trading involves significant risk. You may lose your invested capital.
Risk warning: Forex and CFD trading carries a high risk of loss and is not suitable for everyone. You can lose more than you deposit in some cases. Past patterns, including those in this article, do not predict future results. Nothing here is investment advice.
Related Articles
Power of Three (AMD): ICT Accumulation, Manipulation, Distribution
ICT Power of Three explained: accumulation, manipulation, distribution, the Judas swing and daily open, with times in UTC and our data on how often it appears.

Exness Minimum Deposit: By Account Type, Method and Country
Exness minimum deposit: Standard and Cent need a low first deposit set by payment method and country; Pro, Raw Spread and Zero need at least USD 200, by region.

Head and Shoulders Pattern: Neckline, Target and Real Data
Head and shoulders pattern and inverse head and shoulders: neckline, measured move, stop above the right shoulder, and our data on 141 strict cases.

ICT Silver Bullet: Times, Rules and What Our Data Shows
The ICT silver bullet strategy: the 10-11 am New York window, the sweep-and-FVG entry, time zone conversions, and our data on what that hour does.
Fair Value Gap (FVG): Meaning, Marking and Fill Rates
Fair value gap (FVG) explained: how to spot a three-candle imbalance, the 50% CE level, inverse FVG, BPR, and how often gaps were filled in our own data.
Drawdown in Forex: Max Drawdown, Recovery Math and Limits
Drawdown explained: how to measure maximum drawdown, why a 50% loss needs a 100% gain, how long losing streaks last, and daily and weekly loss limits.